
Benvenuto in dbMeteo
La soluzione Cloud per la gestione dei dati meteorologici, senza bisogno di Console o PC sempre accesi, sia su rete WiFi che in postazioni remote via 4G LTE.
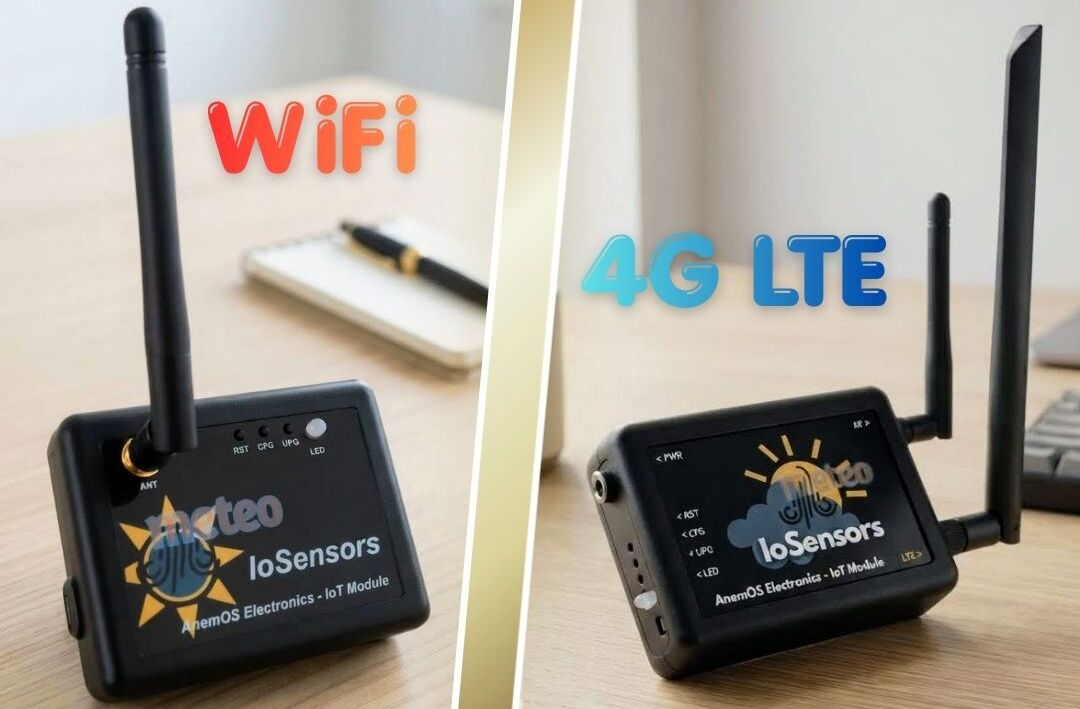 Zoom
Zoom
Cos'è dbMeteo?
dbMeteo rivoluziona l'acquisizione dati stabilendo una connessione diretta tra i sensori esterni e internet. Il modulo IoT riceve i dati in Radiofrequenza e li trasferisce al Cloud tramite WiFi o rete cellulare 4G LTE, offrendo vantaggi unici:
- Flessibilità Totale (WiFi & LTE): Disponibile in versione WiFi standard (5V USB-C) per installazioni domestiche o in versione 4G LTE (12V / solare) per postazioni isolate e totalmente off-grid.
- Risparmio Economico e Logistico: Non è necessario acquistare costose console proprietarie o dedicare un PC sempre acceso all'invio dei dati.
- Compatibilità Totale: Ideale per nuove installazioni, ma perfetto anche per chi possiede già strumentazione completa (lavora in parallelo alla tua console esistente).
- Importazione Storici: Il servizio clienti prevede l'importazione dei tuoi vecchi database per garantire la continuità della tua serie storica.
- Per Sviluppatori: Chi vuole gestire un proprio sito web ha a disposizione una sorgente dati JSON pronta all'uso e widget integrabili.
Il software include una WebAPP ottimizzata per l'analisi e un modulo hardware che garantisce la massima continuità di trasmissione grazie al datalogger e ai sistemi di backup energetico integrati.
Contatti e Acquisto
- 📱 WhatsApp: Chatta con AnemOS Electronics
- 📖 Catalogo: Vedi su WhatsApp
- 🛒 eBay: Visita lo Store
- 📢 Canale News: Iscriviti al Canale dbMeteo
Welcome to dbMeteo
The Cloud solution for weather data management, without Consoles or always-on PCs, both via WiFi and in remote locations via 4G LTE.
Zoom
What is dbMeteo?
dbMeteo revolutionizes data acquisition by establishing a direct connection between external sensors and the internet. The IoT module receives data via Radio Frequency and transfers it to the Cloud via WiFi or 4G LTE cellular network, offering unique advantages:
- Total Flexibility (WiFi & LTE): Available in standard WiFi version (5V USB-C) for home/office setups, or in 4G LTE hybrid version (12V / solar) for isolated, off-grid locations.
- Economic and Logistical Savings: No need to buy expensive proprietary consoles or dedicate an always-on PC for data transmission.
- Full Compatibility: Ideal for new installations, but also perfect for those who already own complete instrumentation (works in parallel with your existing console).
- Historical Data Import: Customer service provides historical database import to ensure continuity of your records.
- For Developers: If you manage your own website, a ready-to-use JSON data source and embeddable widgets are available.
The software includes an optimized WebAPP for analysis and a hardware module that ensures continuous transmission thanks to the integrated datalogger and energy backup systems.
Contacts & Purchase
- 📱 WhatsApp: Chat with AnemOS Electronics
- 📖 Catalog: View on WhatsApp
- 🛒 eBay: Visit the Store
- 📢 News Channel: Join dbMeteo Channel
Bienvenue sur dbMeteo
La solution Cloud pour la gestion des données météorologiques, sans Console ni PC allumé 24h/24, sur réseau WiFi ou sur sites isolés via 4G LTE.
Zoom
Qu'est-ce que dbMeteo ?
dbMeteo révolutionne l'acquisition de données en établissant une connexion directe entre les capteurs externes et internet. Le module IoT reçoit les données par Radiofréquence et les transmet au Cloud via WiFi ou réseau mobile 4G LTE, offrant des avantages uniques :
- Flexibilité Totale (WiFi & LTE) : Disponible en version WiFi standard (5V USB-C) pour les installations domestiques, ou en version 4G LTE hybride (12V / solaire) pour les sites isolés off-grid.
- Économies Économiques et Logistiques : Pas besoin d'acheter des consoles propriétaires coûteuses ou de dédier un PC allumé en permanence.
- Compatibilité Totale : Idéal pour les nouvelles installations, mais aussi parfait pour ceux qui possèdent déjà une instrumentation complète (fonctionne en parallèle avec votre console existante).
- Importation d'Historiques : Le service client prévoit l'importation de vos anciennes bases de données pour assurer la continuité des séries historiques.
- Pour Développeurs : Une source de données JSON prête à l'emploi et des widgets intégrables sont disponibles pour votre site web.
Le logiciel comprend une WebAPP optimisée pour l'analyse et un module matériel qui assure la continuité des données grâce au datalogger et aux systèmes de secours énergétique intégrés.
Contacts & Achat
- 📱 WhatsApp : Chatter avec AnemOS Electronics
- 📖 Catalogue : Voir sur WhatsApp
- 🛒 eBay : Visiter la Boutique
- 📢 Canal News : Rejoindre le Canal dbMeteo
Bienvenido a dbMeteo
La solución en la Nube para la gestión de datos meteorológicos, sin Consola ni PC encendido, tanto por WiFi como en ubicaciones remotas mediante 4G LTE.
Zoom
¿Qué es dbMeteo?
dbMeteo revoluciona la adquisición de datos estableciendo una conexión directa entre los sensores externos e internet. El módulo IoT recibe datos por Radiofrecuencia y los transfiere a la Nube vía WiFi o red celular 4G LTE, ofreciendo ventajas únicas:
- Flexibilidad Total (WiFi y LTE): Disponible en versión WiFi estándar (5V USB-C) para instalaciones domésticas, o en versión híbrida 4G LTE (12V / solar) para ubicaciones aisladas y off-grid.
- Ahorro Económico y Logístico: No es necesario comprar costosas consolas propietarias ni dedicar un PC permanentemente encendido.
- Compatibilidad Total: Ideal para nuevas instalaciones, pero también perfecto para quienes ya poseen instrumentación completa (funciona en paralelo con tu consola existente).
- Importación de Historiales: El servicio al cliente prevé la importación de tus bases de datos antiguas para garantizar la continuidad histórica.
- Para Desarrolladores: Fuente de datos JSON lista para usar y widgets integrables para tu propio sitio web.
El software incluye una WebAPP optimizada para el análisis y un módulo de hardware que garantiza la continuidad de los datos gracias al datalogger y a los sistemas de respaldo energético integrados.
Contactos y Compra
- 📱 WhatsApp: Chatea con AnemOS Electronics
- 📖 Catálogo: Ver en WhatsApp
- 🛒 eBay: Visita la Tienda
- 📢 Canal de Noticias: Únete al Canal dbMeteo
Willkommen bei dbMeteo
Die Cloud-Lösung für das Wetterdatenmanagement ohne Konsole oder Dauer-PC, sowohl über WLAN als auch an abgelegenen Standorten via 4G LTE.
Zoom
Was ist dbMeteo?
dbMeteo revolutioniert die Datenerfassung durch eine direkte Verbindung zwischen Außensensoren und dem Internet. Das IoT-Modul empfängt Daten per Funkfrequenz und überträgt sie per WiFi oder 4G LTE-Mobilfunknetz an die Cloud, was einzigartige Vorteile bietet:
- Volle Flexibilität (WiFi & LTE): Erhältlich in der Standard-WiFi-Version (5V USB-C) für Heim- und Büroumgebungen oder in der 4G LTE-Hybridversion (12V / Solar) für abgelegene Off-Grid-Standorte.
- Wirtschaftliche und Logistische Einsparung: Kein Kauf teurer proprietärer Konsolen oder dedizierter Dauer-PCs erforderlich.
- Volle Kompatibilität: Ideal für Neuinstallationen, aber auch perfekt für vorhandene Instrumente (arbeitet parallel zu Ihrer bestehenden Konsole).
- Historischer Datenimport: Der Kundenservice bietet den Import Ihrer alten Datenbanken an, um die Datenkontinuität zu gewährleisten.
- Für Entwickler: JSON-Datenquelle zur sofortigen Nutzung und einbettbare Widgets für Ihre eigene Website.
Die Software umfasst eine für die Analyse optimierte WebAPP und ein Hardwaremodul, das dank des integrierten Datenloggers und der Energie-Backup-Systeme eine lückenlose Datenübertragung gewährleistet.
Kontakt & Kauf
- 📱 WhatsApp: Chat mit AnemOS Electronics
- 📖 Katalog: Auf WhatsApp ansehen
- 🛒 eBay: Besuchen Sie den Shop
- 📢 News-Kanal: dbMeteo Kanal beitreten
⚙️ Il Modulo IoT (IoSensors)
Specifiche tecniche, installazione e configurazione del dispositivo di ricezione professionale (Varianti WiFi e 4G LTE).
IoSensors è un modulo IoT compatto (90x70x28 mm) ideato, assemblato e programmato in Italia da AnemOS Electronics. Funge da ponte intelligente tra i sensori in radiofrequenza e il Cloud di dbMeteo. È disponibile in due varianti hardware:
- Variante WiFi: con un consumo standard di ~30mA, è alimentabile a 5V via USB-C. Ideale per postazioni con copertura di rete fissa/wireless locale.
- Variante 4G LTE (Ibrida): Progettata per installazioni isolate o off-grid. Con un consumo standard di ~25mA, è alimentabile via jack DC 5mm tramite alimentatore 12V o da pannello solare ~14Vmp. Utilizza la rete cellulare LTE per il trasferimento continuo dei dati meteo, mentre riserva il WiFi esclusivamente alla fase di configurazione e aggiornamento firmware.
Entrambe le varianti campionano autonomamente la pressione atmosferica locale tramite sensore di precisione interno e dispongono di un datalogger Flash da 16.384 pacchetti (circa 57 giorni di archivio) che preserva i dati in caso di mancata copertura di rete.
1. Compatibilità e Parametri
Dal firmware 1.1.0, il modulo supporta l'acquisizione multi-sensore Davis Instruments ed Ecowitt (frequenze 868 e 915 MHz):
e cloni
e cloni
e cloni
e cloni
e cloni
e cloni
e cloni
e cloni
e cloni
💡 Casi d'uso: Oltre i limiti delle console standard
IoSensors permette di scomporre e ricomporre la tua strumentazione assegnando ogni singolo parametro a un sensore o ID radio diverso:
Vento a 10m e temperatura a 2m.
- ✅ Temp/Umidità: Davis ISS (ID 1) a 2m su prato.
- ✅ Vento: Davis Kit Anemometro (ID 2) a 10m sul tetto.
Meccanica Davis + tecnologia a ultrasuoni Ecowitt.
- ✅ Pioggia: Davis ISS (ID 1) basculante di precisione.
- ✅ Vento: Ecowitt WS90 (ID 1) ultrasuoni (zero parti mobili).
Espansione con sensori ausiliari dedicati.
- ✅ Base: Davis Vantage Vue (ID 1).
- ✅ Extra: Ecowitt WH31 in serra + WH54 per livello cisterna.
Recupera vecchi blocchi sensori parzialmente funzionanti.
- ✅ Vento: Vecchio ISS (ID 2) solo per l'anemometro.
- ✅ Resto: Nuovo ISS (ID 1) o sensori singoli Ecowitt.
Accumulo nevoso invernale e bilancio idrico estivo.
- ✅ Base: Davis ISS (ID 1) per clima generale ed ET.
- ✅ Neve: Ecowitt WH54/LDS01 (ID 1) a soffitto come Nivometro.
Sicurezza tende da sole e automazioni su luce e vento.
- ✅ Luce/Vento: Ecowitt WS68 (ID 1) per raffiche e Sole.
- ✅ Pioggia: Ecowitt WH40 (ID 1) risoluzione 0.1mm rapida.
2. Installazione, SIM e Collegamenti
Il modulo è dotato di connettori SMA per le antenne e di un connettore PH2.0 per il backup energetico tramite batteria LiPo:
- Dotazione Variante WiFi: Antenna RF esterna e cavo USB-C. In opzione: batteria LiPo 103450 da 2000mAh già alloggiata internamente.
- Dotazione Variante 4G LTE: Antenna RF + Antenna LTE. In opzione: batteria LiPo 955060 da 4000mAh già alloggiata internamente e alimentatore 12V-1A.
- Tensione del pannello solare (variante LTE): predisporre un pannello solare con una tensione non superiore ai 14V nel punto di massima potenza (Vmp). Pannelli con tensioni superiori risultano inefficienti (soglia MPPT a 11.5V) e potrebbero danneggiare il prodotto
- Avvitare sempre l'antenna LTE prima di alimentare il modulo: L'accensione senza antenna può danneggiare irreversibilmente il modulo modem interno.
- Polarizzazione Ortogonale: In caso di ricezione radio debole dai sensori, orientare le due antenne (RF e LTE) in modo ortogonale (es. una in verticale e una inclinata/orizzontale) per azzerare le interferenze incrociate.
Gestione Energetica e Batterie LiPo:
- Ricarica della batteria: entrambi le varianti provvedono alla ricarica della batteria LiPo. La variante WiFi ricarica con un massimo di 200mAh mentre la LTE fino a 1200mAh
- Consumi da batteria: la variante WiFi ha un consumo di ~700mAh al giorno mentre la LTE di ~1500mAh al giorno
- Uso On-Grid (Domestico con alimentatore): per garantire almeno 2 giorni di funzionamento continuo in caso di blackout, per entrambi le varianti è sufficiente alloggiare internamente le batterie LiPo opzionali.
- Uso Off-Grid (Pannello Solare): per installazioni completamente autonome della variante LTE, si raccomanda una batteria LiPo esterna di maggiore capacità. La custodia dispone di un foro passante sul retro allineato al connettore PH2.0 per facilitare il cablaggio esterno. (Per kit off-grid completi, contattare l'assistenza).
Procedura di Avvio:
- Aprire il retro della custodia se è necessario alloggiare la SIM o connettere la batteria
- Installazione SIM (solo variante LTE): inserire una Nano-SIM nell'apposito slot a ribalta (aprire lo sportellino in metallo, alloggiare la SIM e richiuderlo bloccandolo in posizione).
- Collegare la batteria LiPo al connettore PH2.0 rispettando la polarità.
- Richiudere la custodia e avvitare entrambe le antenne (RF e LTE) sui rispettivi connettori SMA.
- Collegare l'alimentazione (USB-C 5V per la variante WiFi, jack DC 12V per la variante LTE).
-
Verifica LED all'avvio:
- Modello WiFi: ROSSO LAMPEGGIANTE in attesa di configurazione WiFi.
- Modello LTE: BLU LAMPEGGIANTE durante la sequenza di aggancio e registrazione del modem alla cella telefonica.
3. Configurazione Manager (HotSpot)
Per accedere al pannello di configurazione interno, attivare la modalità HotSpot:
- Cliccare sul pulsante RST. Il LED lampeggerà rapidamente in sequenza RGB per 2 secondi.
- Durante questi 2 secondi, premere e tenere premuto il pulsante CFG finché il LED diventa ROSSO FISSO.
- Rilasciare il pulsante CFG: dopo pochi istanti il LED diventerà VERDE FISSO.
- Connettersi con PC o smartphone alla rete WiFi
IoSensors-APed aprire il browser su: http://10.8.0.1
IoSensors-AP non fornisce connettività internet. Se lo smartphone si disconnette in automatico, disattivare temporaneamente i dati mobili (4G/5G) e confermare la permanenza sulla rete locale.
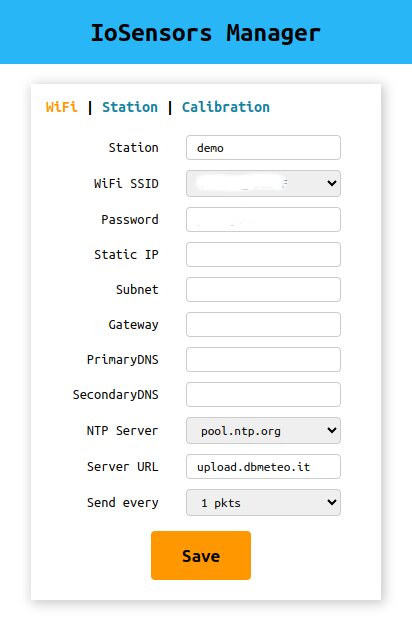
A. Sezione WiFi & Rete
 Zoom
Zoom
- Station: Nome identificativo esatto della stazione registrata su dbMeteo.
- Parametri Cellulari (specifici per variante LTE):
- APN: nome del punto di accesso dell'operatore SIM (es. internet.it, tm.iliad.it, web.ho-mobile.it).
- Roaming: flag da abilitare se l'operatore richiede il roaming dati. Lasciare disabilitato se il roaming prevede costi ulteriori
- Network Mode: selezione della rete mobile (2G o 4G).
- WiFi SSID & Password: Sulla variante WiFi definisce la rete di trasmissione verso dbMeteo; sulla variante LTE serve per agganciare la rete locale durante le procedure di aggiornamento firmware.
- Configurazione IP & DNS: Lasciare vuoto per DHCP (consigliato) oppure inserire i parametri di rete statica.
- Server URL: Indirizzo predefinito del cloud dbMeteo (non modificare salvo indicazioni dell'assistenza).
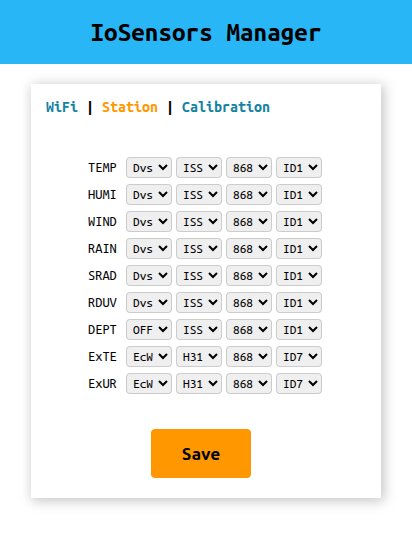
B. Sezione Station (Mapping Sensori)
 Zoom
Zoom
Configurazione a 4 Box per ciascuno dei 9 parametri campionabili:
- Box 1 (Brand): OFF se non presente, oppure Dvs (Davis) o Ecw (Ecowitt).
- Box 2 (Modello): Selezione dell'hardware (ISS, H24, S90, S68, H40, LDS, H31).
- Box 3 (Frequenza): Frequenza radio (868 MHz Europa / 915 MHz USA).
- Box 4 (ID/Ch): ID trasmettitore Davis o Canale del sensore Ecowitt.
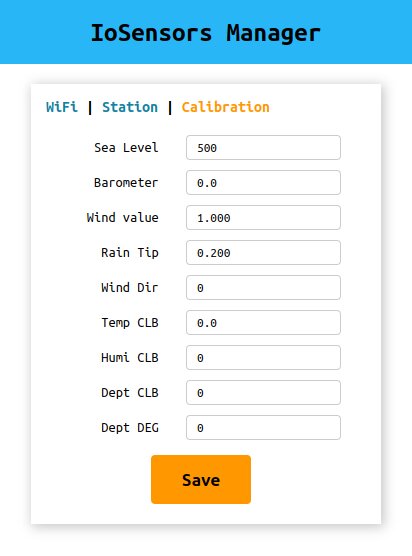
C. Sezione Calibration (Affinamento Dati)
 Zoom
Zoom
- Sea Level: Quota altimetrica (m s.l.m.) per il calcolo della pressione relativa.
- Wind Value & Dir: Fattore moltiplicativo per la velocità e offset per la direzione.
- Rain Tip: Risoluzione bascula pluviometrica in mm (es. 0.1 per WS90/WH40, 0.2 per Davis, 0.3 per WS69).
- Dept CLB & DEG: Altezza da terra (mm) e angolo d'inclinazione per nivometro/profondità.
- Offsets: Calibrazione di precisione per Barometro, Temperatura e Umidità.
Terminata la configurazione, cliccare su Save e riavviare il modulo premendo il tasto RST.
4. Segnali LED Operativi
Durante il funzionamento a regime, il LED di stato segnala l'attività:
- FLASH BLU: Pacchetto dati ricevuto con successo dai sensori radio.
- FLASH VERDE: Pacchetto trasmesso con successo al Cloud dbMeteo (via WiFi o 4G LTE).
5. Aggiornamento Firmware
Per avviare la procedura di verifica e aggiornamento firmware:
- Cliccare sul pulsante RST. Il LED lampeggerà in sequenza RGB per 2 secondi.
- Durante questi 2 secondi, premere e tenere premuto il pulsante UPG finché il LED diventa ROSSO FISSO.
- Rilasciare il pulsante UPG. Il modulo segnalerà lo stato:
- BLU FISSO: Modalità Upgrade attiva.
- VERDE FISSO: Connessione WiFi alla rete di download riuscita.
- Esito procedura:
- BLU LAMPEGGIANTE: Firmware già aggiornato all'ultima versione. Uscire premendo RST.
- RGB CICLICO RAPIDO: Download e scrittura del nuovo firmware in corso. Al termine, il modulo si riavvia automaticamente.
- ROSSO LAMPEGGIANTE: Errore di rete o download interrotto.
⚙️ The IoT Module (IoSensors)
Technical specifications, installation, and configuration of the professional receiver device (WiFi and 4G LTE Variants).
IoSensors is a compact IoT module (90x70x28 mm) designed, assembled, and programmed in Italy by AnemOS Electronics. It acts as a smart bridge between radio frequency weather sensors and the dbMeteo Cloud. It is available in two hardware variants:
- WiFi Variant: with a standard power consumption of ~30mA, powered at 5V via USB-C. Ideal for locations covered by local fixed/wireless networks.
- 4G LTE Variant (Hybrid): Designed for isolated or off-grid installations. With a standard power consumption of ~25mA, it is powered via a 5mm DC jack using a 12V power supply or a ~14Vmp solar panel. It uses the LTE cellular network for continuous weather data transfer, while reserving WiFi exclusively for configuration and firmware updates.
Both variants autonomously sample local atmospheric pressure with an internal precision sensor and feature an integrated 16,384-packet Flash datalogger (approx. 57 days of archive) that preserves data in case of network outages.
1. Compatibility and Parameters
Starting with firmware 1.1.0, the module supports multi-sensor data acquisition from Davis Instruments and Ecowitt (868 and 915 MHz frequencies):
& clones
& clones
& clones
& clones
& clones
& clones
& clones
& clones
& clones
💡 Use Cases: Beyond standard console limits
IoSensors allows you to decompose and recompose your instrumentation by assigning each single parameter to a different sensor or radio ID:
Wind at 10m and temperature at 2m.
- ✅ Temp/Humidity: Davis ISS (ID 1) at 2m on grass.
- ✅ Wind: Davis Anemometer Kit (ID 2) at 10m on roof.
Davis mechanics + Ecowitt ultrasonic technology.
- ✅ Rain: Davis ISS (ID 1) precision tipping bucket.
- ✅ Wind: Ecowitt WS90 (ID 1) ultrasonic (zero moving parts).
Expansion with dedicated auxiliary sensors.
- ✅ Base: Davis Vantage Vue (ID 1).
- ✅ Extra: Ecowitt WH31 in greenhouse + WH54 for cistern level.
Recover old, partially functioning sensor blocks.
- ✅ Wind: Old ISS (ID 2) for anemometer only.
- ✅ Rest: New ISS (ID 1) or individual Ecowitt sensors.
Winter snow accumulation and summer soil ET.
- ✅ Base: Davis ISS (ID 1) for general climate & ET.
- ✅ Snow: Ecowitt WH54/LDS01 (ID 1) ceiling-mounted as snow gauge.
Protect awnings and automate based on light and wind.
- ✅ Light/Wind: Ecowitt WS68 (ID 1) for gusts and Sun.
- ✅ Rain: Ecowitt WH40 (ID 1) 0.1mm fast-response resolution.
💡 Technical Note: Thanks to the Manager's 4-box mapping system, you can instruct IoSensors to "pull" each data point from a different source. The module will aggregate everything into a single coherent data packet sent to the Cloud.
Derived Parameters
In addition to direct measurements, the module or the sensors themselves calculate the following derived parameters:
Davis
calculates this
Ecowitt
calculates this
2. Installation, SIM, and Connections
The module is equipped with SMA antenna connectors and an internal PH2.0 connector for LiPo battery backup:
- WiFi Variant Kit: External RF antenna and USB-C cable. Optional: 2000mAh 103450 LiPo battery pre-housed internally.
- 4G LTE Variant Kit: RF Antenna + LTE Antenna. Optional: 4000mAh 955060 LiPo battery pre-housed internally and 12V-1A power supply.
- Solar Panel Voltage (LTE Variant): provide a solar panel with a voltage not exceeding 14V at the maximum power point (Vmp). Panels with higher voltages are inefficient (MPPT threshold at 11.5V) and may damage the product.
- Always screw the LTE antenna before powering on the module: Powering on without the antenna attached can permanently damage the internal cellular modem.
- Orthogonal Polarization: In case of weak radio reception from sensors, orient the two antennas (RF and LTE) perpendicularly (e.g., one vertical and one tilted/horizontal) to eliminate cross-interference.
Power Management & LiPo Batteries:
- Battery Recharging: both variants automatically recharge the LiPo battery. The WiFi variant recharges at up to 200mAh, while the LTE variant recharges at up to 1200mAh.
- Power Consumption from Battery: the WiFi variant consumes ~700mAh per day, while the LTE variant consumes ~1500mAh per day.
- On-Grid Use (Domestic with power supply): to guarantee at least 2 days of continuous operation during blackouts, the optional internal LiPo batteries are sufficient for both variants.
- Off-Grid Use (Solar Panel): for completely autonomous installations of the LTE variant, a higher-capacity external LiPo battery is recommended. The enclosure features a rear passthrough hole aligned with the PH2.0 connector to facilitate external wiring. (For complete off-grid kits, contact support).
Startup Procedure:
- Open the back of the enclosure if you need to install the SIM or connect the battery.
- SIM Installation (LTE variant only): insert a Nano-SIM into the flip-lock slot (slide and lift the metal latch, place the SIM, close, and slide to lock it in place).
- Connect the LiPo battery to the PH2.0 connector observing correct polarity.
- Close the case and screw both antennas (RF and LTE) firmly onto their SMA connectors.
- Connect power (5V USB-C for WiFi variant, 12V DC jack for LTE variant).
-
LED Verification on startup:
- WiFi Model: BLINKING RED awaiting WiFi configuration.
- LTE Model: BLINKING BLUE during modem boot and cellular network registration.
3. Manager Configuration (HotSpot)
To access the internal management interface, activate HotSpot mode:
- Click the RST button. The LED will rapidly flash in sequence RGB for 2 seconds.
- During these 2 seconds, press and hold the CFG button until the LED turns SOLID RED.
- Release the CFG button: after a few moments the LED will turn SOLID GREEN.
- Using your smartphone or PC, connect to the WiFi network
IoSensors-APand open your browser at: http://10.8.0.1
IoSensors-AP network does not provide internet access. If your smartphone disconnects automatically, temporarily disable mobile data (4G/5G) and confirm that you want to remain connected.
A. WiFi & Network Section
Zoom
- Station: Exact station name registered on dbMeteo.
- Cellular Parameters (Specific to LTE Variant):
- APN: Access Point Name of your SIM carrier (e.g., internet, tm.iliad.it, web.ho-mobile.it).
- Roaming: Checkbox to enable if the carrier requires data roaming. Leave disabled if roaming incurs extra costs.
- Network Mode: Mobile network selection (2G or 4G).
- WiFi SSID & Password: On the WiFi variant, defines the network for data transmission to dbMeteo; on the LTE variant, used to connect to the local network during firmware update procedures.
- IP & DNS Configuration: Leave blank for automatic DHCP (recommended) or enter static network parameters.
- Server URL: Default dbMeteo Cloud server address (do not modify unless instructed by support).
B. Station Section (Sensor Mapping)
Zoom
4-Box configuration for each of the 9 sampleable parameters:
- Box 1 (Brand): OFF if sensor is not present, otherwise choose Dvs (Davis) or Ecw (Ecowitt).
- Box 2 (Model): Hardware selection (ISS, H24, S90, S68, H40, LDS, H31).
- Box 3 (Frequency): Transmission frequency (868 MHz Europe / 915 MHz USA).
- Box 4 (ID/Ch): Davis transmitter ID or specific Ecowitt sensor channel.
C. Calibration Section (Data Refinement)
Zoom
- Sea Level: Altitude (meters) of the station for relative barometric pressure calculation.
- Wind Value & Dir: Multiplier factor for speed and offset for direction.
- Rain Tip: Rain gauge tipping resolution in mm (e.g., 0.1 for WS90/WH40, 0.2 for Davis, 0.3 for WS69).
- Dept CLB & DEG: Initial height from ground (mm) and tilt angle for depth/snow sensor.
- Offsets: Precision calibration offsets for Barometer, Temperature, and Humidity.
Once settings are complete, click Save and restart the module by pressing the RST button.
4. Operating LED Signals
During normal operation, the status LED provides immediate feedback on activity:
- FLASHING BLUE: Data packet successfully received from RF sensors.
- FLASHING GREEN: Data packet successfully transmitted to dbMeteo Cloud (via WiFi or 4G LTE).
5. Firmware Update
To start the firmware check and update procedure:
- Click the RST button. The LED will flash in sequence RGB for 2 seconds.
- During these 2 seconds, press and hold the UPG button until the LED turns SOLID RED.
- Release the UPG button. The module will indicate status:
- SOLID BLUE: Upgrade mode active.
- SOLID GREEN: WiFi connection to download network successful.
- Procedure Outcome:
- BLINKING BLUE: Module already running the latest firmware version. Exit by clicking RST.
- FAST CYCLING RGB: Download and installation in progress. Once finished, the module restarts automatically.
- BLINKING RED: Network error or interrupted download.
⚙️ Le Module IoT (IoSensors)
Spécifications techniques, installation et configuration du récepteur professionnel (Variantes WiFi et 4G LTE).
IoSensors est un module IoT compact (90x70x28 mm) conçu, assemblé et programmé en Italie par AnemOS Electronics. Il sert de pont intelligent entre les capteurs radiofréquences et le Cloud dbMeteo. Il est disponible en deux variantes matérielles :
- Variante WiFi : avec une consommation standard de ~30mA, alimentée en 5V via USB-C. Idéale pour les sites bénéficiant d'une couverture réseau locale fixe ou sans fil.
- Variante 4G LTE (Hybride) : Conçue pour les installations isolées ou off-grid. Avec une consommation standard de ~25mA, elle est alimentée via une prise Jack DC 5mm par transformateur 12V ou directement par panneau solaire ~14Vmp. Elle utilise le réseau mobile LTE pour la transmission continue des données météo, tout en réservant le WiFi exclusivement à la configuration et aux mises à jour firmware.
Les deux variantes échantillonnent de manière autonome la pression atmosphérique locale grâce à un capteur interne de précision et intègrent un datalogger Flash de 16 384 paquets (environ 57 jours d'archive) qui préserve les données en cas d'absence de couverture réseau.
1. Compatibilité et Paramètres
Depuis le firmware 1.1.0, le module prend en charge l'acquisition multi-capteurs Davis Instruments et Ecowitt (fréquences 868 et 915 MHz) :
& clones
& clones
& clones
& clones
& clones
& clones
& clones
& clones
& clones
💡 Cas d'utilisation : Au-delà des limites des consoles standard
IoSensors vous permet de décomposer et recomposer votre instrumentation en assignant chaque paramètre à un capteur ou ID radio différent :
Vent à 10m et température à 2m.
- ✅ Temp/Humidité : Davis ISS (ID 1) à 2m sur gazon.
- ✅ Vent : Kit Anémomètre Davis (ID 2) à 10m sur le toit.
Mécanique Davis + technologie à ultrasons Ecowitt.
- ✅ Pluie : Davis ISS (ID 1) auget basculeur de précision.
- ✅ Vent : Ecowitt WS90 (ID 1) ultrasons (zéro pièce mobile).
Extension avec capteurs auxiliaires dédiés.
- ✅ Base : Davis Vantage Vue (ID 1).
- ✅ Extra : Ecowitt WH31 en serre + WH54 pour niveau de citerne.
Réutilisation d'anciens blocs capteurs partiels.
- ✅ Vent : Ancien ISS (ID 2) pour anémomètre seul.
- ✅ Reste : Nouvel ISS (ID 1) ou capteurs individuels Ecowitt.
Accumulation neigeuse hivernale et bilan ET d'été.
- ✅ Base : Davis ISS (ID 1) pour climat général et ET.
- ✅ Neige : Ecowitt WH54/LDS01 (ID 1) au plafond comme Nivomètre.
Sécurité des stores et automatismes sur lumière et vent.
- ✅ Lumière/Vent : Ecowitt WS68 (ID 1) pour rafales et Soleil.
- ✅ Pluie : Ecowitt WH40 (ID 1) résolution 0.1mm réactive.
💡 Note Technique : Grâce au système de mappage à 4 cases du Manager, vous pouvez programmer IoSensors pour "puiser" chaque mesure d'une source différente. Le module regroupera l'ensemble dans un paquet unique cohérent envoyé au Cloud.
Paramètres Dérivés
En plus des mesures directes, le module ou les capteurs eux-mêmes calculent les paramètres dérivés suivants :
Davis
déjà cette donnée
Ecowitt
déjà cette donnée
2. Installation, SIM et Raccordements
Le module est équipé de connecteurs d'antenne SMA et d'un connecteur PH2.0 interne pour le secours par batterie LiPo :
- Kit Variante WiFi : Antenne RF externe et câble USB-C. En option : batterie LiPo 103450 de 2000mAh préinstallée à l'intérieur.
- Kit Variante 4G LTE : Antenne RF + Antenne LTE. En option : batterie LiPo 955060 de 4000mAh préinstallée à l'intérieur et alimentation 12V-1A.
- Tension du panneau solaire (variante LTE) : utiliser un panneau solaire avec une tension n'excédant pas 14V au point de puissance maximale (Vmp). Les panneaux à tension supérieure sont inefficaces (seuil MPPT à 11.5V) et peuvent endommager le matériel.
- Vissez toujours l'antenne LTE avant d'alimenter le module : La mise sous tension sans antenne connectée peut endommager irrémédiablement le modem interne.
- Polarisation Orthogonale : En cas de réception radio faible des capteurs, orientez les deux antennes (RF et LTE) de manière orthogonale (ex. une verticale et une inclinée/horizontale) pour supprimer les interférences croisées.
Gestion Énergétique et Batteries LiPo :
- Recharge de la batterie : les deux variantes assurent la recharge automatique de la batterie LiPo. La variante WiFi recharge jusqu'à 200mAh tandis que la variante LTE recharge jusqu'à 1200mAh.
- Consommation sur batterie : la variante WiFi consomme ~700mAh par jour alors que la variante LTE consomme ~1500mAh par jour.
- Usage On-Grid (Domestique sur secteur) : pour assurer au moins 2 jours de fonctionnement continu lors des coupures de courant, le logement interne des batteries LiPo optionnelles est suffisant pour les deux variantes.
- Usage Off-Grid (Panneau Solaire) : pour les installations totalement autonomes de la variante LTE, une batterie LiPo externe de plus grande capacité est recommandée. Le boîtier dispose d'un trou passe-câble à l'arrière aligné sur le connecteur PH2.0 pour faciliter le câblage extérieur. (Pour les kits off-grid complets, contactez le support).
Procédure de Démarrage :
- Ouvrir l'arrière du boîtier si nécessaire pour insérer la SIM ou brancher la batterie.
- Installation SIM (variante LTE uniquement) : insérer une Nano-SIM dans le slot à clapet (faire glisser et soulever l'étrier métallique, placer la SIM, rabattre et faire glisser pour verrouiller).
- Brancher la batterie LiPo au connecteur PH2.0 en respectant la polarité.
- Refermer le boîtier et visser fermement les deux antennes (RF et LTE) sur leurs connecteurs SMA respectifs.
- Brancher l'alimentation (USB-C 5V pour la variante WiFi, Jack DC 12V pour la variante LTE).
-
Vérification des signaux LED au démarrage :
- Modèle WiFi : ROUGE CLIGNOTANT en attente de configuration WiFi.
- Modèle LTE : BLEU CLIGNOTANT pendant la phase de démarrage et d'enregistrement du modem au réseau cellulaire.
3. Configuration du Manager (HotSpot)
Pour accéder à l'interface de gestion interne, activez le mode HotSpot :
- Cliquer sur le bouton RST. La LED clignotera rapidement en séquence RGB pendant 2 secondes.
- Pendant ces 2 secondes, maintenir enfoncé le bouton CFG jusqu'à ce que la LED devienne ROUGE FIXE.
- Relâcher le bouton CFG : après quelques instants, la LED deviendra VERTE FIXE.
- Avec votre smartphone ou PC, connectez-vous au réseau WiFi
IoSensors-APet ouvrez le navigateur à l'adresse : http://10.8.0.1
IoSensors-AP ne fournit pas d'accès à internet. Si le smartphone se déconnecte automatiquement, désactivez temporairement les données mobiles (4G/5G) et confirmez le maintien de la connexion sur le réseau local.
A. Section WiFi & Réseau
Zoom
- Station : Identifiant exact de la station enregistrée sur dbMeteo.
- Paramètres Mobiles (spécifiques à la variante LTE) :
- APN : Nom du point d'accès de l'opérateur de la SIM (ex. free, orange, sl2sfr).
- Roaming : Case à cocher si l'opérateur utilise l'itinérance de données. Laisser désactivé si l'itinérance engendre des frais supplémentaires.
- Network Mode : Sélection du réseau mobile (2G ou 4G).
- WiFi SSID & Password : Sur la variante WiFi, définit le réseau pour l'envoi des données vers dbMeteo ; sur la variante LTE, sert à se connecter au réseau local lors des mises à jour firmware.
- Configuration IP & DNS : Laisser vide pour DHCP (recommandé) ou saisir les paramètres de réseau statique.
- Server URL : Adresse du serveur de réception des données (ne pas modifier sauf indication du support).
B. Section Station (Mappage des Capteurs)
Zoom
Configuration à 4 sélecteurs pour chacun des 9 paramètres échantillonnables :
- Box 1 (Brand) : OFF si le capteur est absent, sinon choisir Dvs (Davis) ou Ecw (Ecowitt).
- Box 2 (Modèle) : Sélection du matériel (ISS, H24, S90, S68, H40, LDS, H31).
- Box 3 (Fréquence) : Fréquence de transmission (868 MHz Europe / 915 MHz USA).
- Box 4 (ID/Ch) : ID de l'émetteur Davis ou canal spécifique du capteur Ecowitt.
C. Section Calibration (Affinage des Données)
Zoom
- Sea Level : Altitude (mètres) de la station pour le calcul de la pression barométrique relative.
- Wind Value & Dir : Facteur multiplicateur pour la vitesse et décalage (offset) pour la direction du vent.
- Rain Tip : Résolution de l'auget basculeur en mm (ex. 0.1 pour WS90/WH40, 0.2 pour Davis, 0.3 pour WS69).
- Dept CLB & DEG : Hauteur initiale par rapport au sol (mm) et angle d'inclinaison pour le nivomètre/profondeur.
- Offsets : Calibrations de précision pour Baromètre, Température et Humidité.
Une fois les paramètres terminés, cliquer sur Save et redémarrer le module en appuyant sur le bouton RST.
4. Signaux LED de Fonctionnement
Pendant le fonctionnement normal, la LED de statut fournit un retour immédiat sur l'activité :
- FLASH BLEU : Paquet de données reçu avec succès des capteurs radio.
- FLASH VERT : Données transmises avec succès au Cloud dbMeteo (via WiFi ou 4G LTE).
5. Mise à Jour Firmware
Pour lancer la procédure de vérification et de mise à jour du firmware :
- Cliquer sur le bouton RST. La LED clignotera en séquence RGB pendant 2 secondes.
- Pendant ces 2 secondes, maintenir enfoncé le bouton UPG jusqu'à ce que la LED devienne ROUGE FIXE.
- Relâcher le bouton UPG. Le module indiquera son état :
- BLEU FIXE : Mode Upgrade actif.
- VERT FIXE : Connexion WiFi au réseau de téléchargement réussie.
- Résultat de la procédure :
- BLEU CLIGNOTANT : Le module possède déjà la dernière version. Quitter en cliquant sur RST.
- RGB CYCLIQUE RAPIDE : Téléchargement et écriture du nouveau firmware en cours. À la fin, le module redémarre automatiquement.
- ROUGE CLIGNOTANT : Erreur réseau ou téléchargement interrompu.
⚙️ El Módulo IoT (IoSensors)
Especificaciones técnicas, instalación y configuración del dispositivo receptor profesional (Variantes WiFi y 4G LTE).
IoSensors es un módulo IoT compacto (90x70x28 mm) diseñado, ensamblado y programado en Italia por AnemOS Electronics. Actúa como puente inteligente entre los sensores de radiofrecuencia y la nube dbMeteo. Está disponible en dos variantes de hardware:
- Variante WiFi: con un consumo estándar de ~30mA, alimentada a 5V vía USB-C. Ideal para ubicaciones con cobertura de red fija o inalámbrica local.
- Variante 4G LTE (Híbrida): Diseñada para instalaciones aisladas o sin conexión fija (off-grid). Con un consumo estándar de ~25mA, se alimenta a través de un jack DC de 5mm mediante transformador de 12V o directamente desde un panel solar de ~14Vmp. Utiliza la red celular LTE para la transferencia continua de datos meteorológicos, reservando el WiFi exclusivamente para la configuración y actualización de firmware.
Ambas variantes realizan de forma autónoma el muestreo de la presión atmosférica local mediante un sensor interno de precisión y disponen de un datalogger Flash de 16.384 paquetes (aproximadamente 57 días de registro) que preserva los datos en caso de pérdida de cobertura de red.
1. Compatibilidad y Parámetros
A partir del firmware 1.1.0, el módulo soporta la adquisición multisensor de Davis Instruments y Ecowitt (frecuencias de 868 y 915 MHz):
y clones
y clones
y clones
y clones
y clones
y clones
y clones
y clones
y clones
💡 Casos de uso: Más allá de los límites de las consolas estándar
IoSensors permite descomponer y recomponer tu instrumentación asignando cada parámetro a un sensor o ID de radio diferente:
Viento a 10m y temperatura a 2m.
- ✅ Temp/Humedad: Davis ISS (ID 1) a 2m sobre césped.
- ✅ Viento: Kit Anemómetro Davis (ID 2) a 10m en el tejado.
Mecánica Davis + tecnología ultrasónica de Ecowitt.
- ✅ Lluvia: Davis ISS (ID 1) balancín de precisión.
- ✅ Viento: Ecowitt WS90 (ID 1) ultrasónico (cero partes móviles).
Expansión con sensores auxiliares dedicados.
- ✅ Base: Davis Vantage Vue (ID 1).
- ✅ Extra: Ecowitt WH31 en invernadero + WH54 para nivel de depósito.
Reutiliza bloques de sensores antiguos parcialmente operativos.
- ✅ Viento: ISS antiguo (ID 2) solo para el anemómetro.
- ✅ Resto: Nuevo ISS (ID 1) o sensores individuales Ecowitt.
Acumulación de nieve invernal y cálculo ET en verano.
- ✅ Base: Davis ISS (ID 1) para clima general y ET.
- ✅ Nieve: Ecowitt WH54/LDS01 (ID 1) en techo como Nivómetro.
Seguridad para toldos y automatizaciones por luz y viento.
- ✅ Luz/Viento: Ecowitt WS68 (ID 1) para ráfagas y Sol.
- ✅ Lluvia: Ecowitt WH40 (ID 1) resolución 0.1mm de respuesta rápida.
💡 Nota Técnica: Gracias al sistema de mapeo de 4 cuadros del Manager, puedes instruir a IoSensors para "recoger" cada dato de una fuente distinta. El módulo agregará todo en un único paquete de datos coherente enviado a la Nube.
Parámetros Derivados
Además de las medidas directas, el módulo o los propios sensores calculan los siguientes parámetros derivados:
Davis
este dato
Ecowitt
este dato
2. Instalación, SIM y Conexiones
El módulo está equipado con conectores SMA para las antenas y un conector PH2.0 interno para respaldo energético mediante batería LiPo:
- Dotación Variante WiFi: Antena RF externa y cable USB-C. Opcional: batería LiPo 103450 de 2000mAh prealojada internamente.
- Dotación Variante 4G LTE: Antena RF + Antena LTE. Opcional: batería LiPo 955060 de 4000mAh prealojada internamente y alimentador de 12V-1A.
- Tensión del panel solar (variante LTE): utilizar un panel solar con una tensión que no supere los 14V en el punto de máxima potencia (Vmp). Paneles con tensiones superiores resultan ineficientes (umbral MPPT a 11.5V) y pueden dañar el equipo.
- Atornille siempre la antena LTE antes de alimentar el módulo: El encendido sin la antena conectada puede dañar de forma irreversible el módem interno.
- Polarización Ortogonal: En caso de recepción de radio débil de los sensores, oriente las dos antenas (RF y LTE) de forma ortogonal (ej. una en vertical y otra inclinada/horizontal) para anular las interferencias cruzadas.
Gestión Energética y Baterías LiPo:
- Recarga de la batería: ambas variantes gestionan automáticamente la recarga de la batería LiPo. La variante WiFi recarga con un máximo de 200mAh mientras que la variante LTE recarga hasta 1200mAh.
- Consumo desde batería: la variante WiFi tiene un consumo de ~700mAh al día mientras que la LTE consume ~1500mAh al día.
- Uso On-Grid (Doméstico con alimentador): para garantizar al menos 2 días de funcionamiento continuo ante cortes de luz, el alojamiento interno de las baterías LiPo opcionales es suficiente para ambas variantes.
- Uso Off-Grid (Panel Solar): para instalaciones completamente autónomas de la variante LTE, se recomienda una batería LiPo externa de mayor capacidad. La carcasa dispone de un orificio pasante en la parte trasera alineado con el conector PH2.0 para facilitar el cableado exterior. (Para kits off-grid completos, consulte con el servicio técnico).
Procedimiento de Inicio:
- Abrir la parte posterior de la carcasa si es necesario instalar la SIM o conectar la batería.
- Instalación SIM (solo variante LTE): insertar una Nano-SIM en la ranura abatible (deslizar y levantar la pestaña metálica, alojar la SIM, cerrar y bloquear deslizando la pestaña a su posición).
- Conectar la batería LiPo al conector PH2.0 respetando la polaridad.
- Cerrar la carcasa y atornillar firmemente ambas antenas (RF y LTE) en sus respectivos conectores SMA.
- Conectar la alimentación (5V USB-C para la variante WiFi, jack DC de 12V para la variante LTE).
-
Verificación de señales LED al inicio:
- Modelo WiFi: ROJO PARPADEANTE en espera de configuración WiFi.
- Modelo LTE: AZUL PARPADEANTE durante la secuencia de inicio y registro del módem en la red celular.
3. Configuración del Manager (HotSpot)
Para acceder al panel de configuración interno, active el modo HotSpot:
- Pulsar el botón RST. El LED parpadeará rápidamente en secuencia RGB durante 2 segundos.
- Durante estos 2 segundos, mantener presionado el botón CFG hasta que el LED se vuelva ROJO FIJO.
- Soltar el botón CFG: tras unos instantes el LED pasará a VERDE FIJO.
- Con su smartphone o PC, conéctese a la red WiFi
IoSensors-APy abra el navegador en: http://10.8.0.1
IoSensors-AP no proporciona conexión a internet. Si el smartphone se desconecta automáticamente, desactive temporalmente los datos móviles (4G/5G) y confirme que desea permanecer conectado a la red local.
A. Sección WiFi y Red
Zoom
- Station: Nombre identificativo exacto de la estación registrada en dbMeteo.
- Parámetros Celulares (específicos para variante LTE):
- APN: Nombre del punto de acceso del operador de la SIM (ej. movistar.es, orangeworld, ac.vodafone.es).
- Roaming: Marcar casilla si el operador requiere itinerancia de datos. Dejar desmarcado si la itinerancia supone costes adicionales.
- Network Mode: Selección del tipo de red móvil (2G o 4G).
- WiFi SSID & Password: En la variante WiFi define la red para el envío de datos a dbMeteo; en la variante LTE sirve para conectarse a la red local durante las actualizaciones de firmware.
- Configuración IP & DNS: Dejar en blanco para asignación automática por DHCP (recomendado) o introducir parámetros de red fija.
- Server URL: Dirección predeterminada de la nube dbMeteo (no modificar salvo indicación de soporte).
B. Sección Station (Mapeo de Sensores)
Zoom
Configuración de 4 selectores para cada uno de los 9 parámetros medibles:
- Box 1 (Brand): OFF si no está presente, o bien Dvs (Davis) o Ecw (Ecowitt).
- Box 2 (Modelo): Selección del hardware (ISS, H24, S90, S68, H40, LDS, H31).
- Box 3 (Frecuencia): Frecuencia de transmisión (868 MHz Europa / 915 MHz EE.UU.).
- Box 4 (ID/Ch): ID de transmisión Davis o canal específico del sensor Ecowitt.
C. Sección Calibration (Calibración de Datos)
Zoom
- Sea Level: Altitud (metros sobre el nivel del mar) para el cálculo de la presión barométrica relativa.
- Wind Value & Dir: Factor multiplicador de velocidad y corrección (offset) de dirección del viento.
- Rain Tip: Resolución de vuelco del pluviómetro en mm (ej. 0.1 para WS90/WH40, 0.2 para Davis, 0.3 para WS69).
- Dept CLB & DEG: Altura inicial respecto al suelo (mm) y ángulo de inclinación para nivómetro/profundidad.
- Offsets: Ajustes de precisión para Barómetro, Temperatura y Humedad.
Una vez completados los ajustes, hacer clic en Save y reiniciar el módulo pulsando el botón RST.
4. Señales LED Operativas
Durante el funcionamiento normal, el LED de estado ofrece información inmediata sobre la actividad:
- FLASH AZUL: Paquete de datos recibido con éxito desde los sensores de radio.
- FLASH VERDE: Paquete de datos transmitido con éxito a dbMeteo (vía WiFi o 4G LTE).
5. Actualización de Firmware
Para iniciar el procedimiento de verificación y actualización de firmware:
- Pulsar el botón RST. El LED parpadeará en secuencia RGB durante 2 segundos.
- Durante estos 2 segundos, mantener presionado el botón UPG hasta que el LED se vuelva ROJO FIJO.
- Soltar el botón UPG. El módulo indicará su estado:
- AZUL FIJO: Modo Upgrade activo.
- VERDE FIJO: Conexión WiFi a la red de descarga establecida con éxito.
- Resultado del procedimiento:
- AZUL PARPADEANTE: El módulo ya dispone de la versión más reciente. Salir pulsando RST.
- RGB CÍCLICO RÁPIDO: Descarga y escritura del nuevo firmware en curso. Al finalizar, el módulo se reinicia automáticamente.
- ROJO PARPADEANTE: Error de red o descarga interrumpida.
⚙️ Das IoT-Modul (IoSensors)
Technische Spezifikationen, Installation und Konfiguration des professionellen Empfangsgeräts (WiFi- und 4G LTE-Varianten).
IoSensors ist ein kompaktes IoT-Modul (90x70x28 mm), entwickelt, zusammengebaut und programmiert in Italien von AnemOS Electronics. Es fungiert als intelligente Brücke zwischen Funk-Wettersensoren und der dbMeteo-Cloud. Es ist in zwei Hardware-Varianten erhältlich:
- WiFi-Variante: mit einem Standard-Stromverbrauch von ~30mA, wird mit 5V über USB-C betrieben. Ideal für Standorte mit lokaler Festnetz- oder WLAN-Abdeckung.
- 4G LTE-Variante (Hybrid): Entwickelt für abgelegene oder autonome (Off-Grid) Installationen. Mit einem Standard-Stromverbrauch von ~25mA wird sie über eine 5mm DC-Buchse per 12V-Netzteil oder direkt über ein ~14Vmp Solarmodul betrieben. Sie nutzt das LTE-Mobilfunknetz für die kontinuierliche Wetterdatenübertragung, während WLAN ausschließlich für die Konfiguration und Firmware-Updates reserviert ist.
Beide Varianten tasten den lokalen Luftdruck mithilfe eines internen Präzisionssensors völlig autonom ab und verfügen über einen Flash-Datalogger für 16.384 Datenpakete (ca. 57 Tage Archiv), der die Daten bei Netzunterbrechungen zuverlässig sichert.
1. Kompatibilität und Parameter
Ab der Firmware 1.1.0 unterstützt das Modul die Multi-Sensor-Datenerfassung von Davis Instruments und Ecowitt (Frequenzen 868 und 915 MHz):
und Klone
und Klone
und Klone
und Klone
und Klone
und Klone
und Klone
und Klone
und Klone
💡 Anwendungsfälle: Über die Grenzen herkömmlicher Konsolen hinaus
IoSensors ermöglicht das Zerlegen und neu Zusammensetzen Ihrer Instrumentierung, indem Sie jeden einzelnen Parameter einem anderen Sensor oder einer anderen Funk-ID zuweisen:
Wind in 10m und Temperatur in 2m Höhe.
- ✅ Temp/Feuchte: Davis ISS (ID 1) in 2m auf Rasen.
- ✅ Wind: Davis Anemometer-Kit (ID 2) in 10m auf dem Dach.
Davis-Mechanik + Ultraschalltechnologie von Ecowitt.
- ✅ Regen: Davis ISS (ID 1) Präzisions-Wippenmesser.
- ✅ Wind: Ecowitt WS90 (ID 1) Ultraschall (keine beweglichen Teile).
Erweiterung mit spezialisierten Zusatzsensoren.
- ✅ Basis: Davis Vantage Vue (ID 1).
- ✅ Extra: Ecowitt WH31 im Gewächshaus + WH54 für Zisternenstand.
Teilweise funktionierende alte Sensoren weiterverwenden.
- ✅ Wind: Altes ISS (ID 2) nur für den Windmesser.
- ✅ Rest: Neues ISS (ID 1) oder einzelne Ecowitt-Sensoren.
Schneeakkumulation im Winter und sommerliche ET.
- ✅ Basis: Davis ISS (ID 1) für allgemeines Klima und ET.
- ✅ Schnee: Ecowitt WH54/LDS01 (ID 1) an der Decke als Schneemesser.
Markisenschutz und Hausautomation über Licht und Wind.
- ✅ Licht/Wind: Ecowitt WS68 (ID 1) für Böen und Sonne.
- ✅ Regen: Ecowitt WH40 (ID 1) 0,1mm Auflösung für schnelles Schließen.
💡 Technischer Hinweis: Dank des 4-Box-Mapping-Systems des Managers können Sie IoSensors anweisen, jeden Datenpunkt von einer anderen Quelle zu beziehen. Das Modul bündelt alles zu einem einzigen konsistenten Datenpaket für die Cloud.
Abgeleitete Parameter
Neben den Direktmessungen berechnet das Modul oder die Sensoren selbst folgende abgeleitete Werte:
Davis
dies bereits
Ecowitt
dies bereits
2. Installation, SIM und Anschlüsse
Das Modul ist mit SMA-Antennenanschlüssen und einem internen PH2.0-Anschluss für die LiPo-Akkusicherung ausgestattet:
- Lieferumfang WiFi-Variante: Externe RF-Antenne und USB-C-Kabel. Optional: intern vorinstallierter 2000mAh 103450 LiPo-Akku.
- Lieferumfang 4G LTE-Variante: RF-Antenne + LTE-Antenne. Optional: intern vorinstallierter 4000mAh 955060 LiPo-Akku und 12V-1A Netzteil.
- Solarmodul-Spannung (LTE-Variante): Ein Solarmodul mit maximal 14V im Punkt maximaler Leistung (Vmp) verwenden. Module mit höheren Spannungen sind ineffizient (MPPT-Schwelle bei 11,5V) und können das Gerät beschädigen.
- LTE-Antenne immer vor dem Einschalten anschrauben: Das Einschalten ohne angeschlossene Antenne kann das interne Mobilfunkmodem dauerhaft zerstören.
- Orthogonale Polarisation: Bei schwachem Funksignal die beiden Antennen (RF und LTE) rechtwinklig zueinander ausrichten (z. B. eine vertikal und eine geneigt/horizontal), um Kreuzinterferenzen zu vermeiden.
Energieverwaltung und LiPo-Akkus:
- Akkuladung: Beide Varianten laden den LiPo-Akku automatisch auf. Die WiFi-Variante lädt mit maximal 200mAh, während die LTE-Variante mit bis zu 1200mAh lädt.
- Stromverbrauch über Akku: Die WiFi-Variante verbraucht ~700mAh pro Tag, die LTE-Variante ~1500mAh pro Tag.
- On-Grid-Nutzung (Netzbetrieb mit Netzteil): Um bei Stromausfällen mindestens 2 Tage Dauerbetrieb zu gewährleisten, reicht das interne Einsetzen der optionalen LiPo-Akkus bei beiden Varianten aus.
- Off-Grid-Nutzung (Solarmodul): Für völlig autonome Installationen der LTE-Variante wird ein größerer externer LiPo-Akku empfohlen. Das Gehäuse verfügt über eine rückseitige Kabeldurchführung auf Höhe des PH2.0-Anschlusses. (Für komplette Off-Grid-Kits kontaktieren Sie bitte den Support).
Inbetriebnahme:
- Rückseite des Gehäuses öffnen, falls die SIM eingesetzt oder der Akku angeschlossen werden muss.
- SIM-Installation (nur LTE-Variante): Nano-SIM in den Klapp-Slot einsetzen (Metallbügel aufschieben, anheben, SIM einlegen, schließen und verriegeln).
- LiPo-Akku an den PH2.0-Anschluss polungsrichtig anschließen.
- Gehäuse schließen und beide Antennen (RF und LTE) festschrauben.
- Stromversorgung anschließen (5V USB-C für WiFi-Variante, 12V DC-Buchse für LTE-Variante).
-
LED-Überprüfung beim Start:
- WiFi-Modell: ROT BLINKEND während des Wartens auf WLAN-Konfiguration.
- LTE-Modell: BLAU BLINKEND während der Startsequenz und Netzeinwahl des Modems.
3. Manager-Konfiguration (HotSpot)
Um die interne Konfigurationsoberfläche aufzurufen, aktivieren Sie den HotSpot-Modus:
- Die Taste RST drücken. Die LED blinkt für 2 Sekunden schnell im RGB-Wechsel.
- Während dieser 2 Sekunden die Taste CFG gedrückt halten, bis die LED DAUERHAFT ROT leuchtet.
- Die Taste CFG loslassen: Nach wenigen Augenblicken leuchtet die LED DAUERHAFT GRÜN.
- Mit Smartphone oder PC mit dem WLAN
IoSensors-APverbinden und im Browser aufrufen: http://10.8.0.1
IoSensors-AP bietet keinen Internetzugang. Falls sich das Smartphone automatisch trennt, mobile Daten (4G/5G) vorübergehend deaktivieren und bestätigen, dass Sie im lokalen Netzwerk bleiben möchten.
A. WLAN & Netzwerk-Bereich
Zoom
- Station: Exakter Stationsname, der bei der dbMeteo-Registrierung verwendet wurde.
- Mobilfunk-Parameter (spezifisch für LTE-Variante):
- APN: Zugangspunktname des SIM-Anbieters (z. B. internet.telekom, web.vodafone.de).
- Roaming: Aktivieren, falls der Anbieter Datenroaming erfordert. Deaktiviert lassen, wenn Roaming zusätzliche Kosten verursacht.
- Network Mode: Auswahl des Mobilfunknetzes (2G oder 4G).
- WiFi SSID & Password: Bei der WiFi-Variante das Netzwerk für den Datenversand zu dbMeteo; bei der LTE-Variante dient es zur Verbindung mit dem lokalen Netz bei Firmware-Updates.
- IP & DNS-Konfiguration: Leer lassen für DHCP (empfohlen) oder statische Netzwerkparameter eintragen.
- Server URL: Standard-Serveradresse der dbMeteo-Cloud (nur nach Anweisung des Supports ändern).
B. Station-Bereich (Sensor-Mapping)
Zoom
4-Box-Konfiguration für jeden der 9 messbaren Parameter:
- Box 1 (Brand): OFF falls nicht vorhanden, sonst Dvs (Davis) oder Ecw (Ecowitt).
- Box 2 (Modell): Hardwareauswahl (ISS, H24, S90, S68, H40, LDS, H31).
- Box 3 (Frequenz): Übertragungsfrequenz (868 MHz Europa / 915 MHz USA).
- Box 4 (ID/Ch): Davis-Sender-ID oder spezifischer Ecowitt-Sensorkanal.
C. Calibration-Bereich (Datenverfeinerung)
Zoom
- Sea Level: Meereshöhe (Meter) der Station zur Berechnung des relativen Luftdrucks.
- Wind Value & Dir: Multiplikator für die Geschwindigkeit und Offset für die Windrichtung.
- Rain Tip: Auflösung der Regenwippe in mm (z. B. 0.1 für WS90/WH40, 0.2 für Davis, 0.3 für WS69).
- Dept CLB & DEG: Anfangshöhe vom Boden (mm) und Neigungswinkel für Schneehöhen-/Tiefensensor.
- Offsets: Präzisionskalibrierung für Barometer, Temperatur und Luftfeuchtigkeit.
Nach Abschluss der Einstellungen auf Save klicken und das Modul durch Drücken der Taste RST neu starten.
4. Betriebs-LED-Signale
Während des regulären Betriebs gibt die Status-LED sofortiges Feedback:
- BLAUER BLITZ: Datenpaket erfolgreich von den Funksensoren empfangen.
- GRÜNER BLITZ: Datenpaket erfolgreich an die dbMeteo-Cloud übertragen (via WiFi oder 4G LTE).
5. Firmware-Update
So starten Sie die Firmware-Prüfung und das Update:
- Die Taste RST drücken. Die LED blinkt für 2 Sekunden schnell im RGB-Wechsel.
- Während dieser 2 Sekunden die Taste UPG gedrückt halten, bis die LED DAUERHAFT ROT leuchtet.
- Die Taste UPG loslassen. Das Modul signalisiert den Status:
- DAUERHAFT BLAU: Upgrade-Modus aktiv.
- DAUERHAFT GRÜN: WLAN-Verbindung zum Download-Netzwerk erfolgreich.
- Ergebnis der Prozedur:
- BLAU BLINKEND: Modul verfügt bereits über die neueste Version. Mit RST beenden.
- SCHNELLES RGB-ZYKLISCHES BLINKEN: Download und Installation laufen. Nach Abschluss startet das Modul automatisch neu.
- ROT BLINKEND: Netzwerkfehler oder Download abgebrochen.
📷 Telecamere IP e Streaming Video
Come collegare qualsiasi telecamera di rete al Cloud dbMeteo per lo streaming Live HLS, la Time Machine e i video Timelapse.
Oltre all'acquisizione dei dati meteo tramite il modulo IoSensors, l'infrastruttura Cloud di dbMeteo include un potente server di acquisizione video. Il flusso della telecamera viene convertito automaticamente in formato HLS a bassa latenza per la diretta sul web, archiviato a intervalli regolari per la consultazione a ritroso (Time Machine) ed elaborato per generare i filmati Timelapse MP4 scaricabili dalla WebAPP.
Non sei vincolato a modelli proprietari: qualsiasi telecamera IP standard conforme al formato H.264 può essere collegata a dbMeteo.
1. Come Connettere la Telecamera al Cloud
dbMeteo prevede tre modalità di collegamento per adattarsi sia alle nuove installazioni che agli impianti già esistenti:
È la modalità più moderna e semplice. La telecamera invia attivamente il proprio flusso video verso il server dbMeteo, comportandosi come un normale client.
- ✅ Zero configurazione del Router: Nessuna porta da aprire sul modem (No NAT / No Port Forwarding).
- ✅ Funzionamento garantito su reti 4G/LTE: Funziona regolarmente con qualsiasi SIM dati anche sotto il blocco delle connessioni in ingresso (CGNAT) tipico degli operatori mobili.
- ✅ Sicurezza assoluta: La telecamera non è esposta su Internet, azzerando qualsiasi rischio di intrusione.
Parametri di configurazione da inserire nella telecamera:
- Configurazione a URL Unico (Push URL):
rtmp://dbmeteo.it/nomeaccount?pwd=latuapassword - Configurazione a Campi Separati (Server + Stream Key):
• Server / Host URL:rtmp://dbmeteo.it
• Stream Key / Stream Name:nomeaccount?pwd=latuapassword
Se possiedi già una telecamera installata priva della funzione RTMP nativa (o che supporta solo il protocollo RTSP locale), non è necessario sostituirla. Un piccolo dispositivo sempre acceso nella stessa rete locale (es. un Raspberry Pi, un Mini-PC Linux o un NAS) può prelevare il flusso RTSP interno e rilanciarlo in RTMP Push verso dbMeteo.
Comando FFmpeg pronto all'uso (Copia Stream trasparente - Zero carico CPU):
ffmpeg -rtsp_transport tcp -i "rtsp://192.168.1.50:554/live/ch0" -c copy -f flv "rtmp://dbmeteo.it/nomeaccount?pwd=latuapassword"Grazie all'istruzione -c copy, il flusso non viene ricodificato: il processore lavora con un carico trascurabile (<1%), consentendo di mantenere tutti i vantaggi dell'RTMP Push anche con hardware datato.
In questa modalità, è il server dbMeteo a collegarsi dall'esterno al modem dell'utente per prelevare il flusso RTSP della telecamera.
- Richiede connessione fissa con IP Pubblico: Non funziona su normali connessioni 4G/LTE a causa del blocco delle connessioni in entrata imposto dai gestori telefonici (CGNAT).
- Apertura porte sul Router (NAT): È necessario configurare il port forwarding sul modem (inoltrando ad esempio la porta esterna 554 verso la telecamera locale).
- Servizio Dynamic DNS (DDNS): Se la linea non dispone di IP statico, occorre configurare un host DDNS (es. No-IP, DuckDNS).
- Sicurezza: Per proteggere la telecamera da scansioni automatiche su Internet, imposta una password molto robusta e inoltra una porta esterna non standard (es. porta esterna
20554mappata sulla554interna).
Come attivarla: Dopo aver aperto e verificato la porta sul tuo router, comunica al supporto dbMeteo la tua stringa completa (es. rtsp://utente:password@miodns.net:20554/live/ch0) per consentire al server di agganciare il flusso.
2. Parametri di Configurazione Video (Disciplinare Tecnico)
Indipendentemente dalla modalità di trasmissione utilizzata, la telecamera deve essere impostata nel proprio menu di configurazione video con i seguenti parametri obbligatori:
3. Guida alla Scelta dell'Hardware e Requisiti Ottici
La mia telecamera attuale è compatibile?
Certamente sì. Se possiedi già una telecamera IP per videosorveglianza in grado di erogare un flusso H.264 (direttamente in RTMP o tramite RTSP), puoi integrarla subito in dbMeteo seguendo i punti precedenti.
Devi acquistare una nuova telecamera? Ecco cosa considerare:
Per il monitoraggio meteorologico all'aperto, la tecnologia del sensore fa un'enorme differenza tra il giorno e la notte:
Gli illuminatori IR illuminano solo fino a pochi metri. Con pioggia, nebbia, neve o insetti, i raggi rimbalzano vicino all'obiettivo creando un forte bagliore bianco accecante, mentre le montagne, la vallata e il cielo restano completamente neri.
Raccomandiamo telecamere dotate di sensori ottici a bassissimo lux (commercialmente note come Full-Color, ColorVu o Starlight) con ottiche luminose (f/1.0 o f/1.4) e sensori generosi da 1/1.8" o 1/2.8". Questi apparati sfruttano la minima luce ambientale (luna, stelle o luci dei paesi) mostrando il paesaggio e le nubi a colori anche in piena notte, permettendo di distinguere banchi di nebbia, nubi basse e quota neve a chilometri di distanza.
💡 Vuoi andare sul sicuro? Contattaci per il modello collaudato
Il mercato delle telecamere IP è vasto e in continua evoluzione. Selezioniamo e testiamo costantemente sul campo i modelli commerciali più affidabili che combinano visione notturna a colori reale e trasmissione RTMP Push nativa senza bisogno di PC o ponti (come ad esempio la serie Dahua WizSense Full-Color).
Prima di acquistare una nuova telecamera, contatta l'assistenza dbMeteo / AnemOS su WhatsApp: ti indicheremo il modello attualmente proposto e verificato, fornendoti supporto nella configurazione iniziale.
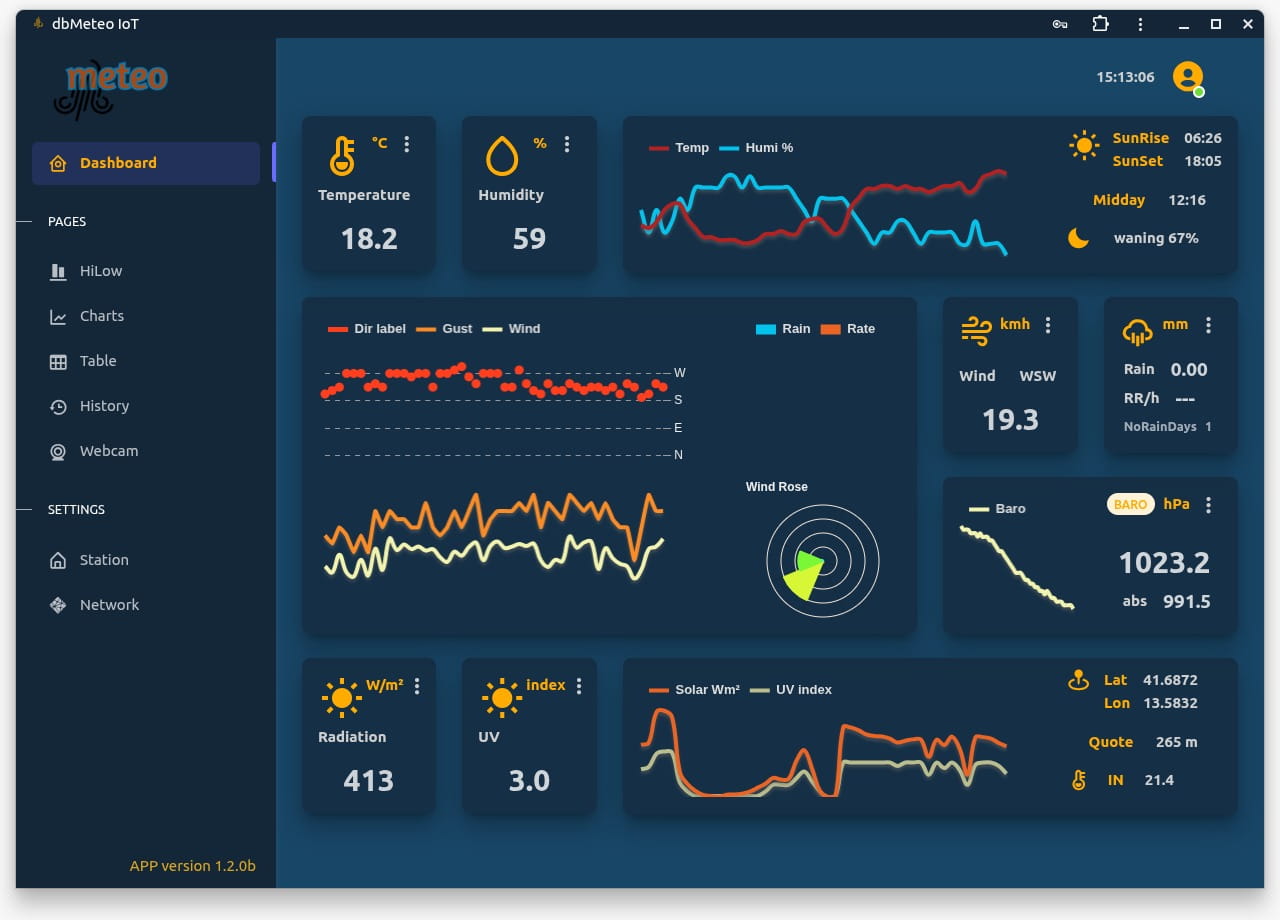
💻 Il Software (WebAPP)
Pannello di controllo, analisi dati e gestione della stazione in Cloud.
 Zoom
Zoom
Il cuore del sistema è accessibile via browser all'indirizzo www.dbmeteo.it o tramite la WebAPP installata.
Sviluppato come PWA (Progressive Web App), il software offre un'esperienza identica a un'app nativa ma senza passare dagli store. Una volta installata, l'app si avvia a schermo intero, senza barre di navigazione.
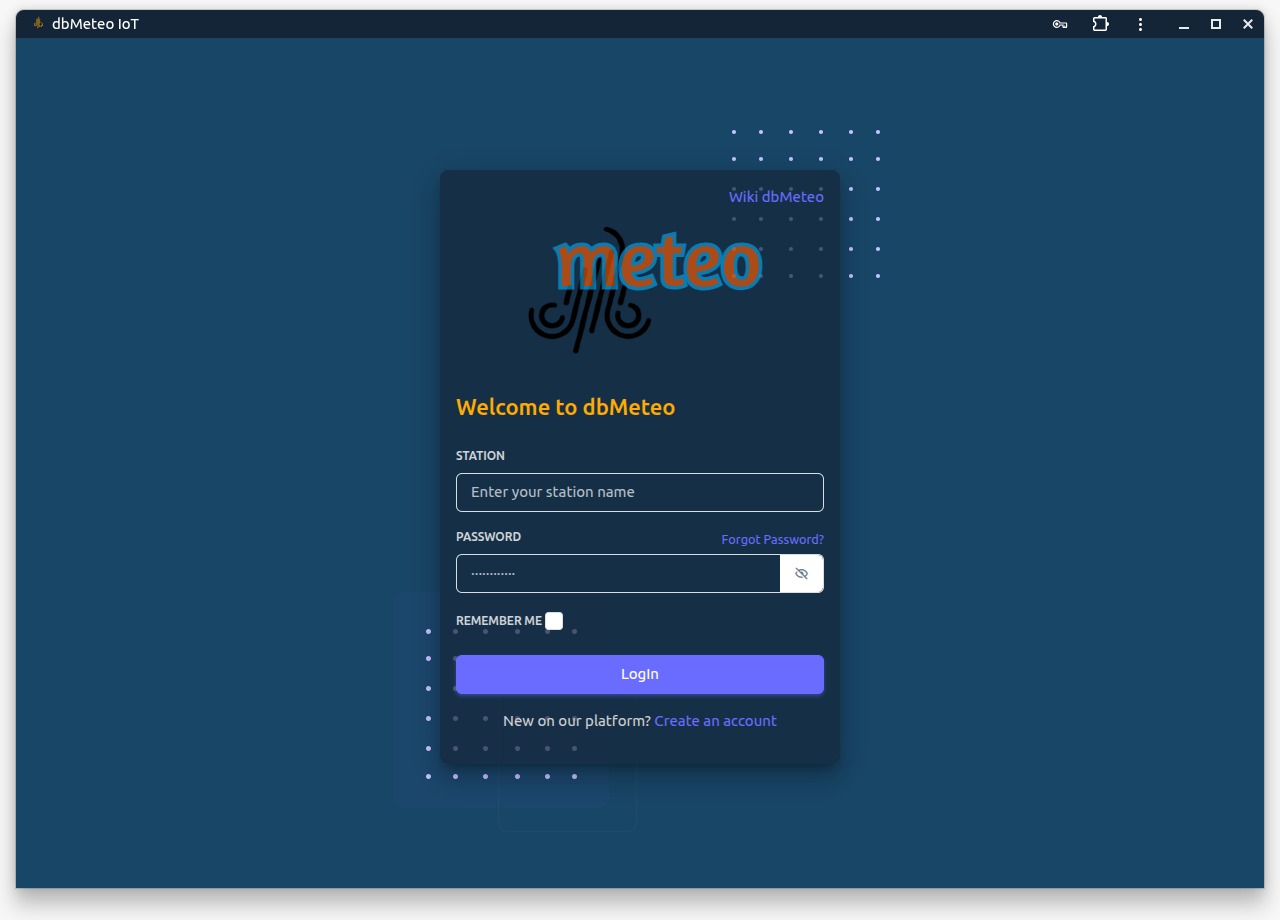
2. Creazione Account e Configurazione
 Zoom
Zoom
Apri la WebAPP installata (o vai su www.dbmeteo.it) e clicca su Create an account.
- Station: Scegli un nome identificativo per la tua stazione (es. bustoarsizio, tutto minuscolo). Questo sarà il tuo ID univoco per tutto il sistema.
- Email: Inserisci un indirizzo valido per ricevere il link di attivazione e le notifiche di sistema.
- Password: Crea una password sicura (10 caratteri) o clicca su auto per generarne una casuale e robusta.
Dopo aver cliccato Register, controlla la tua casella di posta e clicca sul link di conferma per attivare l'utenza.
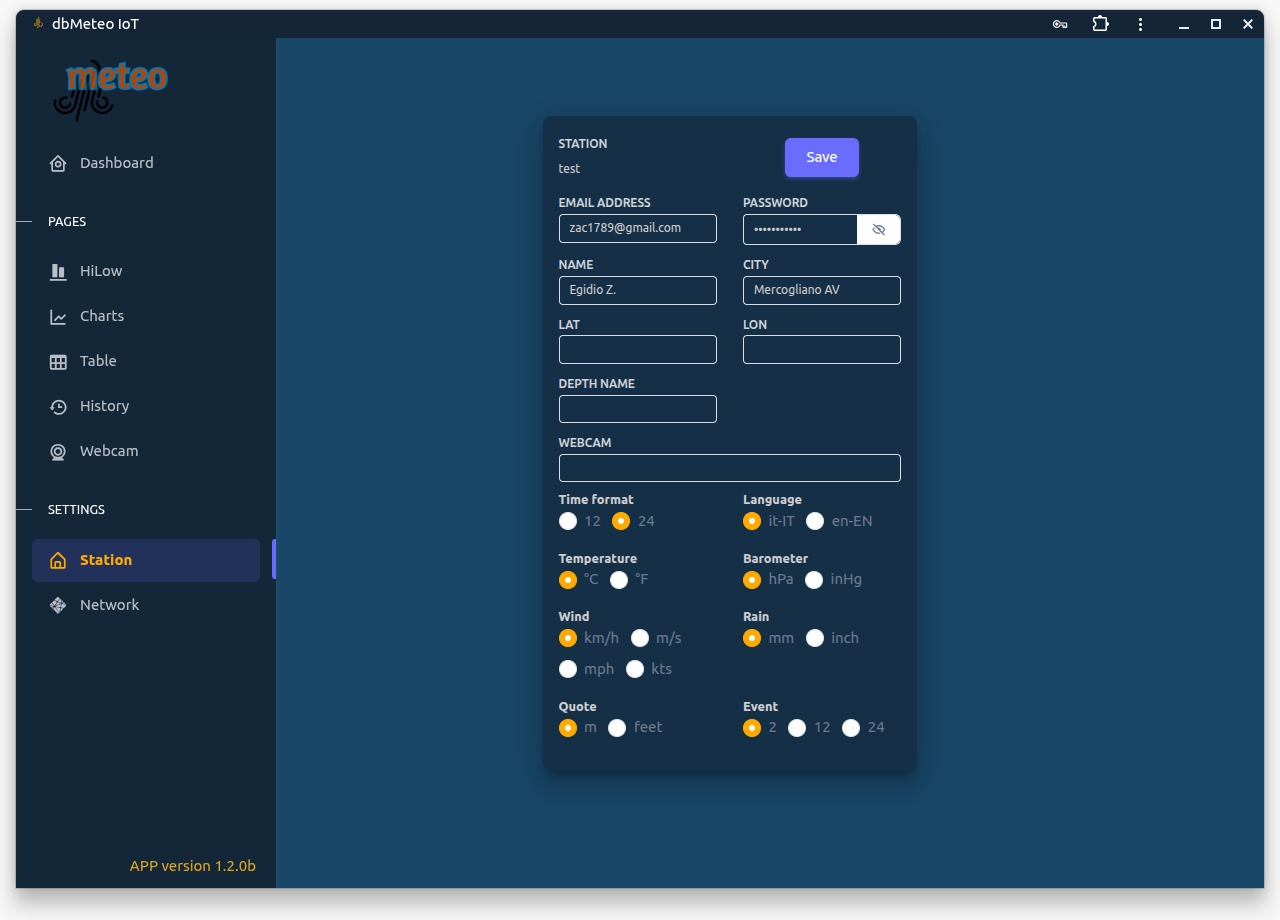
Sezione Station (Profilo)
 Zoom
Zoom
Dopo il primo login, accedi al menu Station per configurare i parametri della tua postazione:
- Email address: Indirizzo e-mail di riferimento per le comunicazioni del sistema.
- Name: Nome e cognome del gestore della postazione (es. Mario Rossi).
- City: Città o località dove è installata la stazione.
- Lat / Lon: Coordinate decimali esatte. Fondamentali per stabilire il fuso orario e il corretto calcolo dei dati solari (Alba/Tramonto).
- Depth name: Etichetta personalizzata da visualizzare per il sensore di profondità (es. Nivometro).
- Webcam: URL di un'immagine JPG statica da prelevare e visualizzare nella sezione Webcam.
- Formati e Unità: Configura il formato orario (12/24h), la lingua, e le unità di misura preferite per Temperatura, Barometro, Vento, Pioggia e Quota.
- Event: Tempo in ore (2, 12 o 24) trascorso il quale un evento piovoso viene considerato terminato.
3. La Dashboard Interattiva
La dashboard è il centro di comando principale. Grazie al sistema di icone e Popper, puoi monitorare i dati in tempo reale senza sovraffollare l'interfaccia.
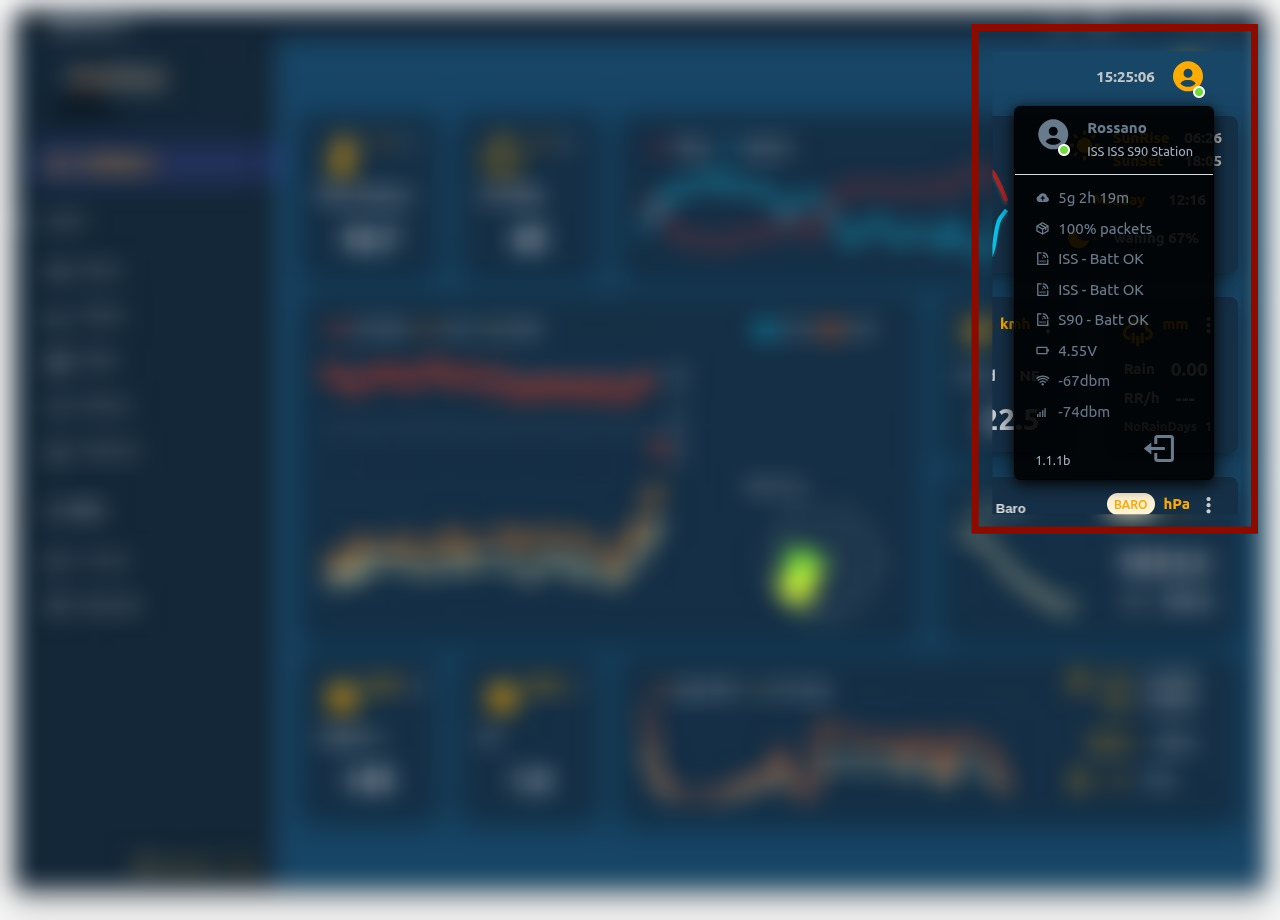
User Popper (Stato Sistema)
 Zoom
Zoom
Cliccando sull'icona utente in alto a destra, appare un menu diagnostico immediato:
- Stato Online: Cerchio verde per dati aggiornati (ricezione recente), rosso se il modulo non comunica correttamente.
- Statistiche Hardware: Tempo dall'ultimo riavvio (Uptime), tensione batterie, potenza segnale WiFi o LTE, segnale radio RF e versione Firmware del modulo.
- Logout: Per disconnettersi in sicurezza dalla WebAPP.
Data Popper (Dettaglio Sensori)
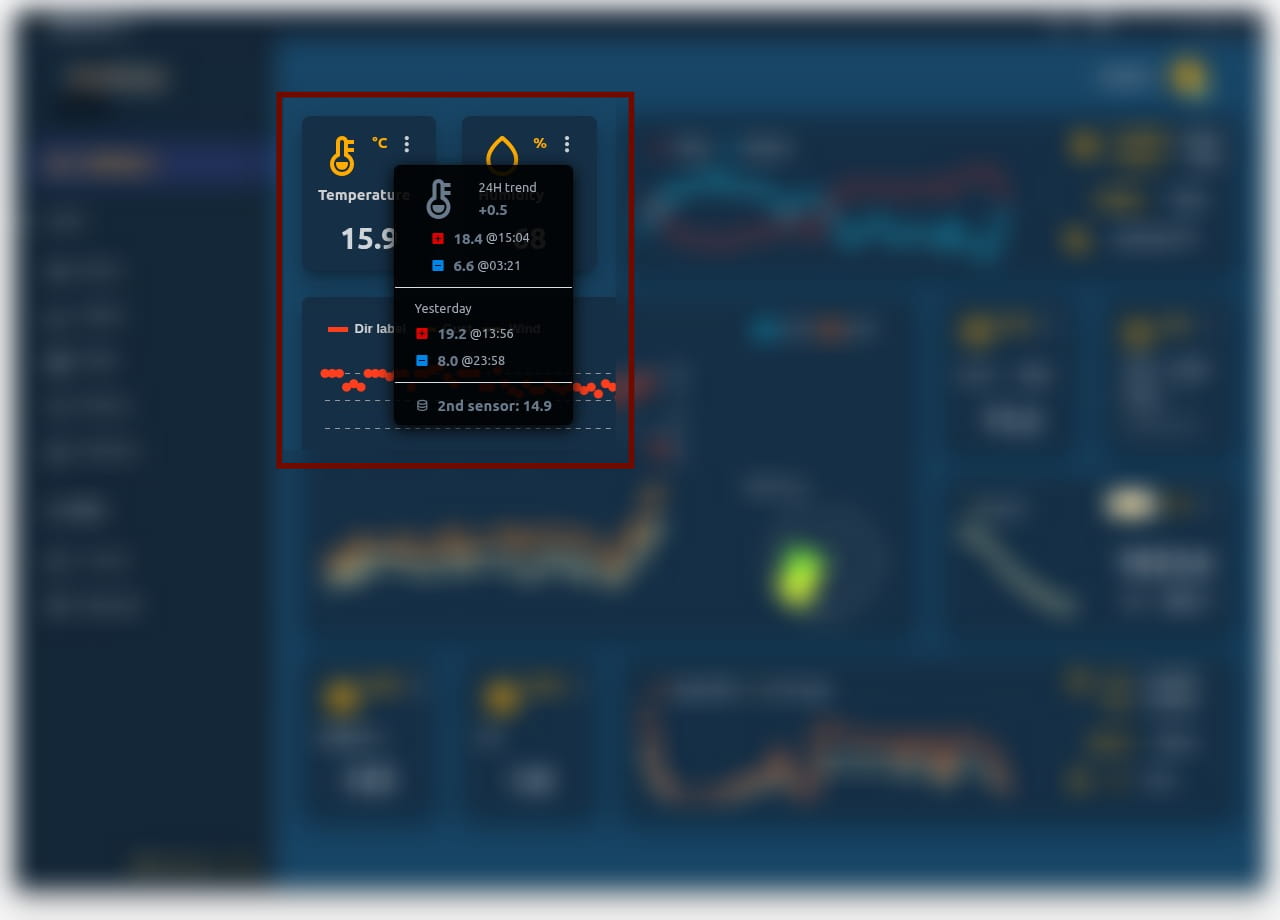 Zoom
Zoom
Cliccando sui tre puntini verticali presenti in ogni card (Temperatura, Umidità, Pressione, Vento, ecc.), si apre un popper di dettaglio che mostra:
- Andamento: Visualizzazione estesa del parametro specifico.
- Dati Extra: Ulteriori informazioni correlate al sensore selezionato, garantendo una lettura profonda senza occupare spazio prezioso nella vista principale.
Rain Data Popper (Dettaglio Pioggia)
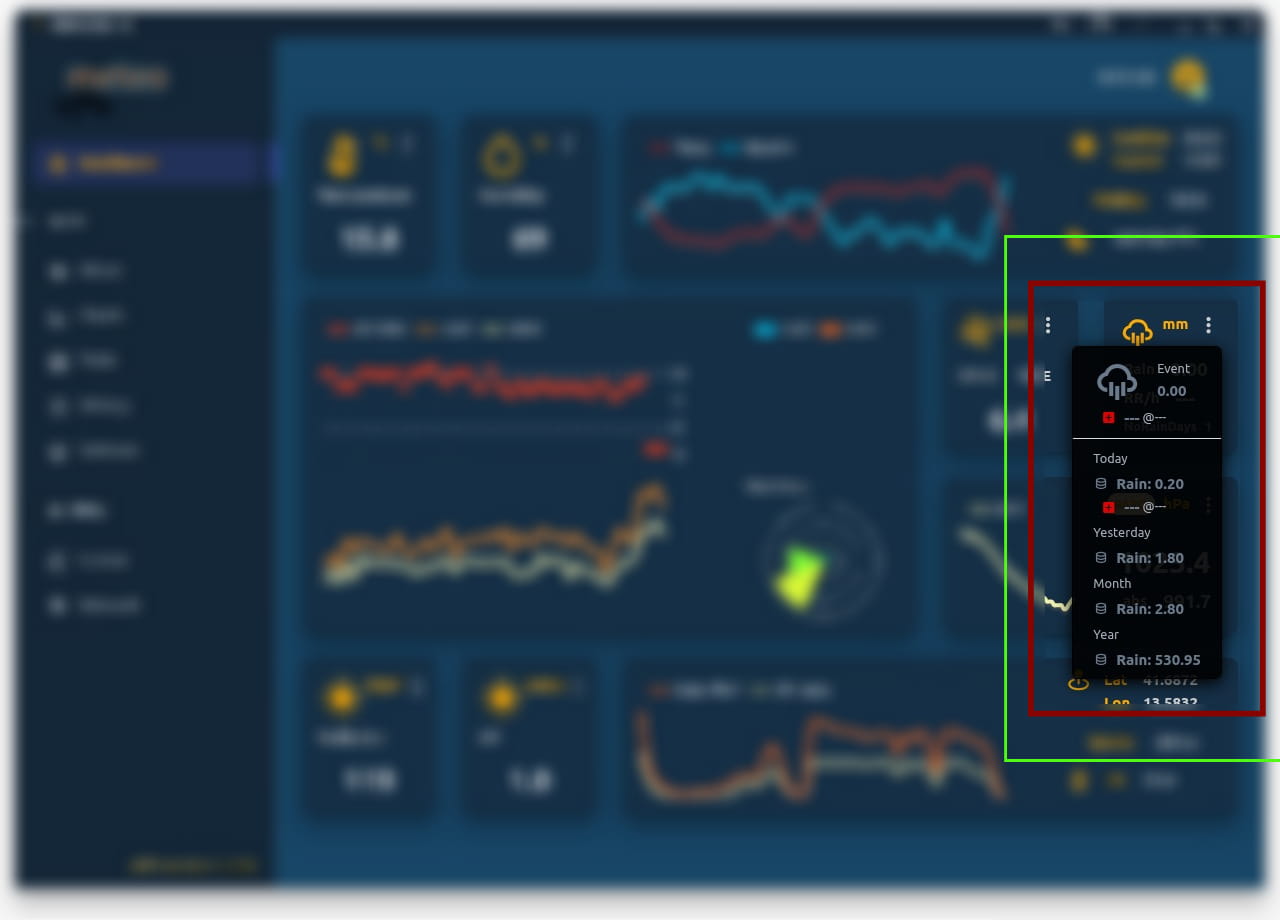 Zoom
Zoom
Questo popper offre una visione avanzata dell'idrometria:
- Accumulo Evento: Il totale della pioggia caduta nell'evento in corso, separato automaticamente in base all'intervallo temporale impostato nelle impostazioni Station.
- Rain Rate: Intensità massima registrata.
- Storico: Confronto diretto tra l'accumulo giornaliero corrente e quello del giorno precedente.
4-Hours Charts (Grafici Rapidi)
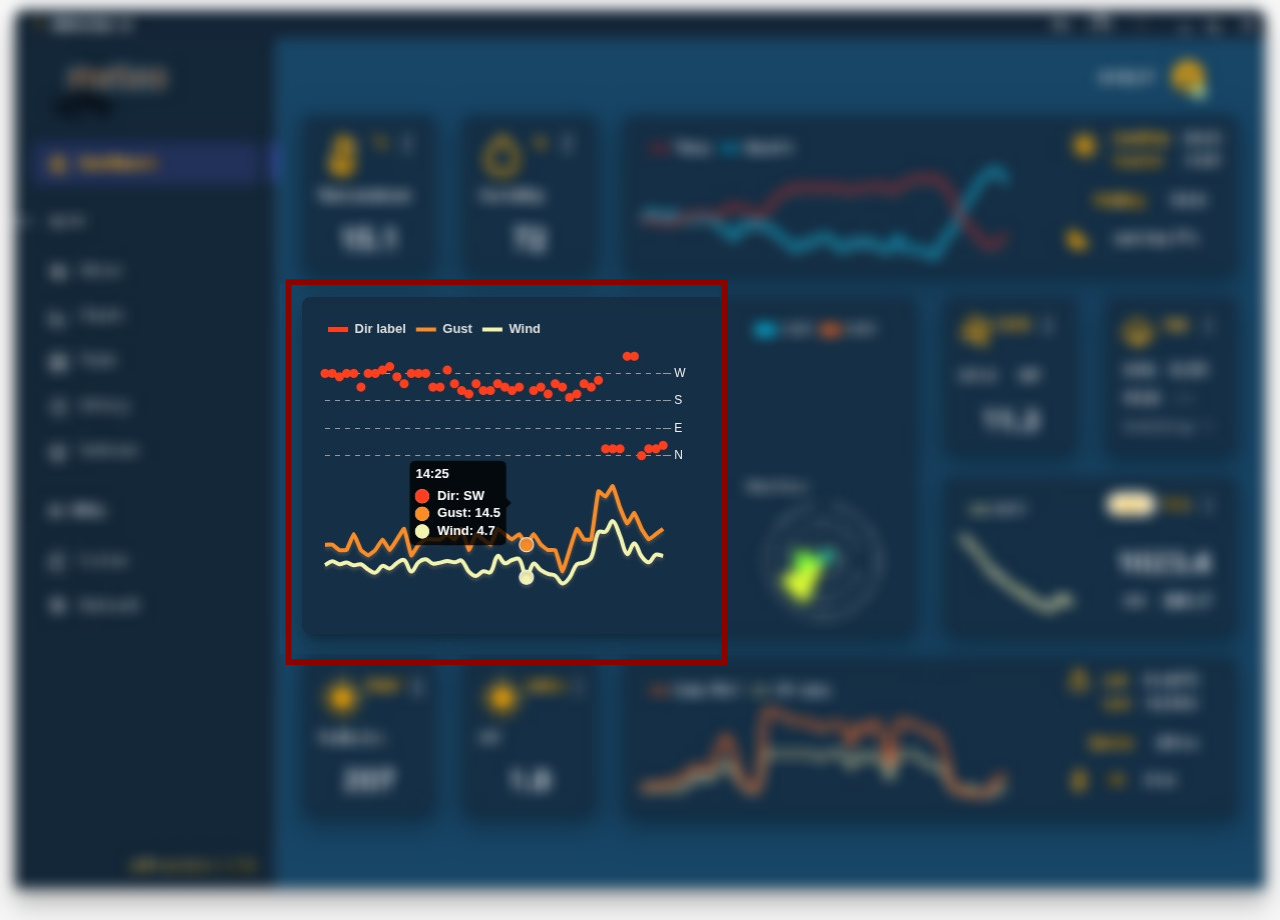 Zoom
Zoom
Nella parte centrale della dashboard sono sempre visibili i grafici delle ultime quattro ore per tutti i parametri campionati.
Questi grafici sono interattivi: passando il mouse sul tracciato (o toccando con il dito) è possibile leggere il valore esatto di ogni punto sulla serie temporale, permettendo di monitorare rapidi cambiamenti meteo o raffiche di vento recenti.
4. Analisi Dati (HiLow & Charts)
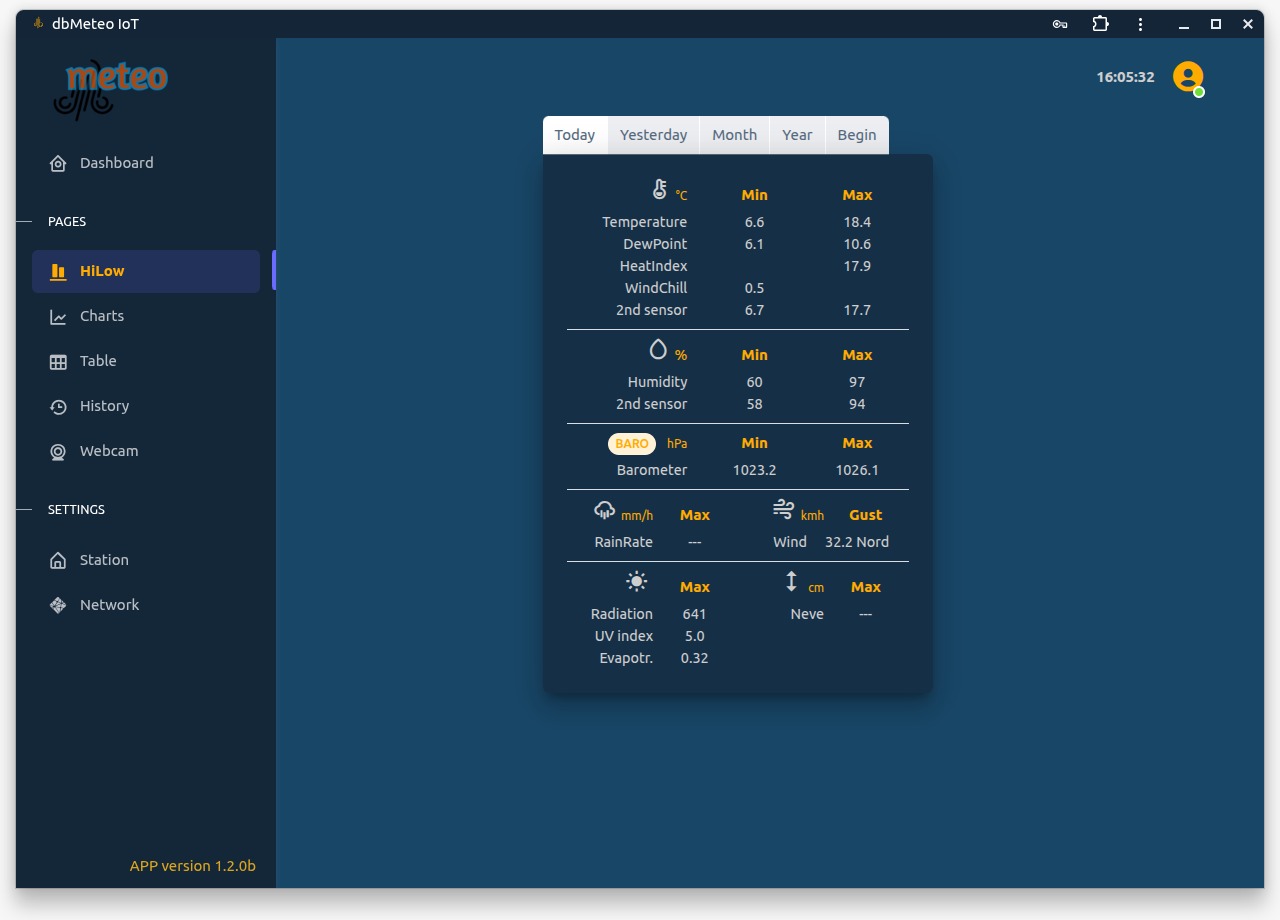 Zoom
Zoom
HiLow (Estremi)
Tabella record per Oggi, Mese, Anno e Assoluti con data e ora.
 Zoom
Zoom
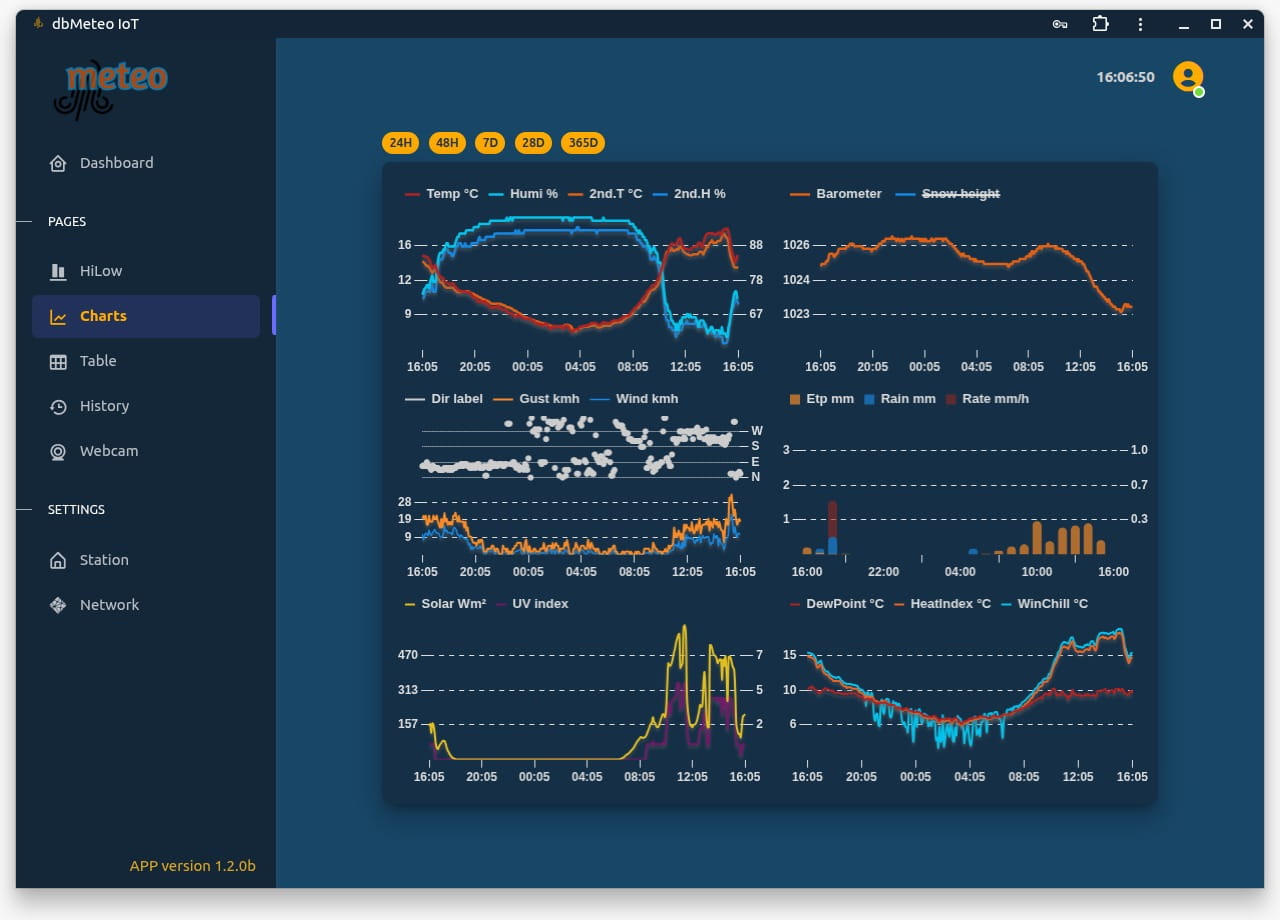
Charts (Grafici Storici)
Analisi storica zoomabile per 24H, 48H, 7D, 28D e 365D.
5. Gestione Storico (Table & History)
 Zoom
Zoom
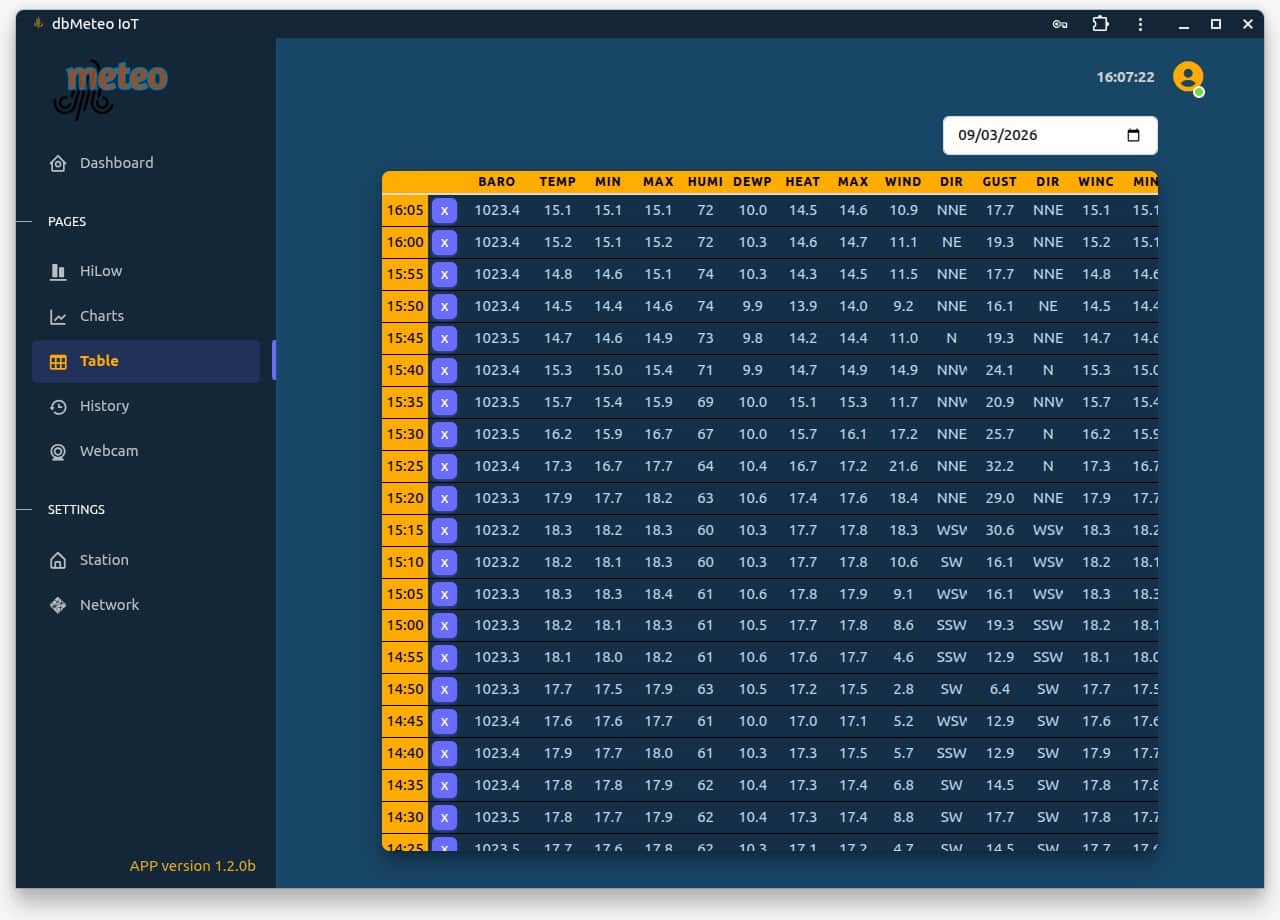
Table (Log Dettagliato)
Log a 5 minuti. Possibilità di cancellare righe (X) o modificare valori cliccando sulle celle.
 Zoom
Zoom
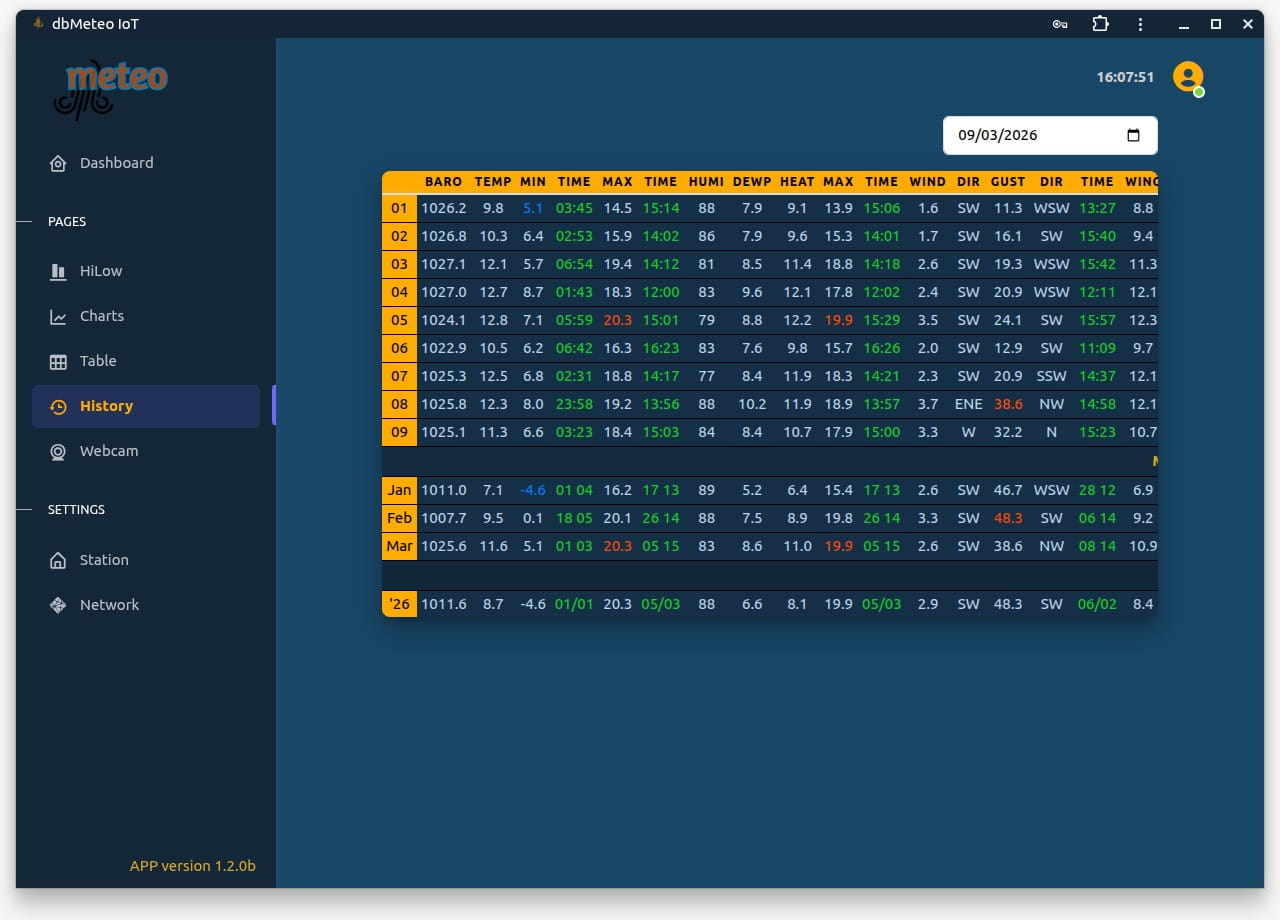
History
Riepiloghi giornalieri, mensili e annuali.
6. Streaming (Live & Time Machine)
 Zoom
Zoom
Webcam Live, Storico e Video Timelapse
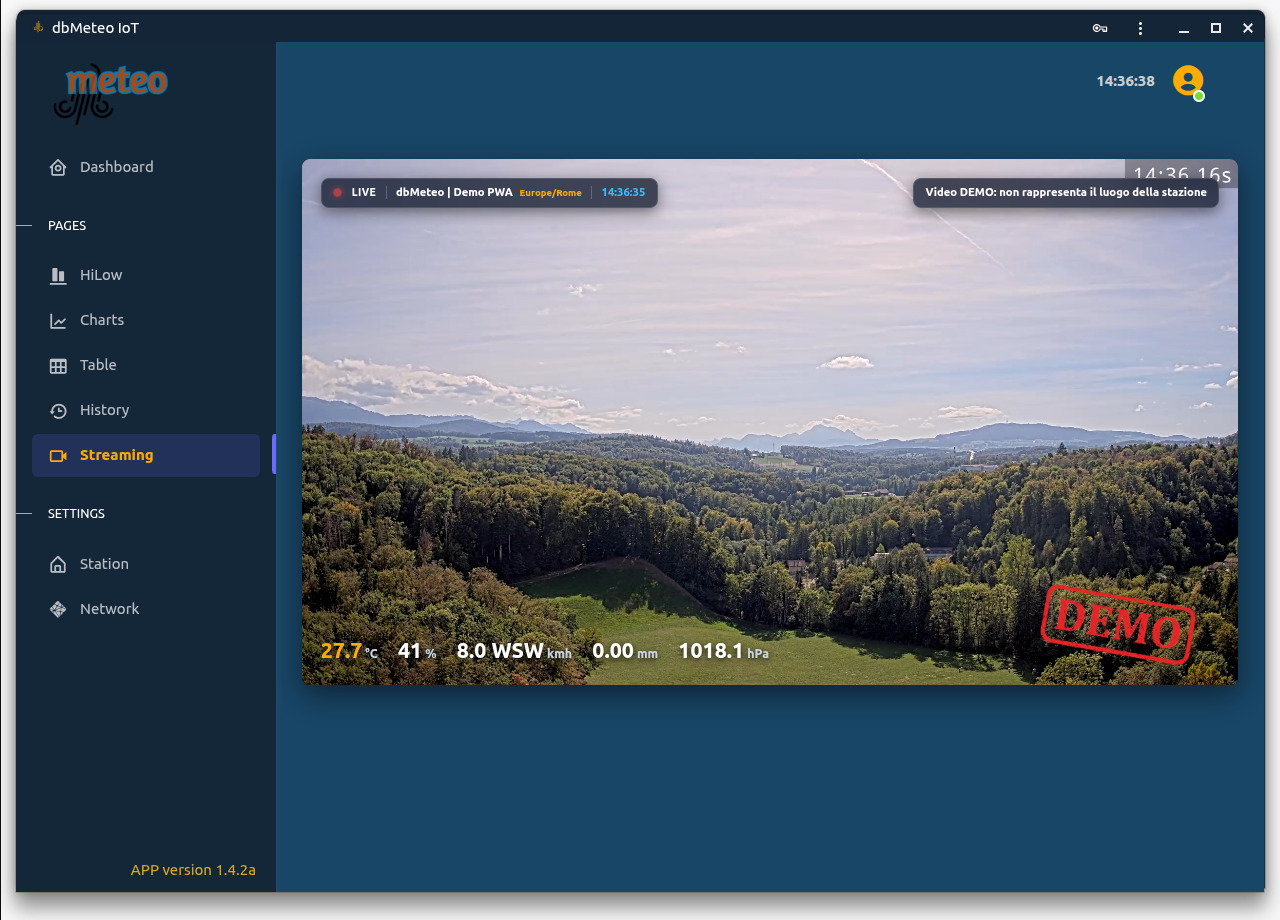
La sezione Streaming della WebAPP è la centrale di controllo del flusso video della tua stazione. Integra un player proprietario modulare ad alte prestazioni che unisce le immagini panoramiche alla telemetria meteorologica in tempo reale.
- Diretta HLS a Bassa Latenza: Riproduzione video fluida in tempo reale (H.264) con overlay trasparente dei parametri meteo correnti (temperatura, vento, pioggia, pressione, umidità) e orologio sincronizzato.
- Time Machine (Timeline Interattiva 24h): Tramite lo slider inferiore o i tasti di scelta rapida (-2h, -6h, -24h, ORA), è possibile riavvolgere il tempo e scorrere i fotogrammi ad alta definizione dell'intera giornata. A ogni fotogramma visualizzato, il badge e la telemetria si aggiornano istantaneamente mostrando i dati meteo registrati esattamente in quel minuto.
- Esclusiva WebAPP - Download Video Timelapse (MP4): A differenza del sito pubblico (che funge da solo visualizzatore per i visitatori), la WebAPP integra un potente motore di esportazione video. Cliccando sull'icona di download () si apre il generatore video:
- Selezione dell'intervallo temporale tramite preset rapidi (2, 6, 12, 24 ore) o cursori manuali di inizio e fine.
- Scelta della velocità di riproduzione (10 FPS lento, 15 FPS fluido, 25 FPS rapido).
- Generazione e download diretto del file video MP4 (H.264) con barra di avanzamento dinamica.
- Personalizzazione Grafica Completa: Cliccando sull'icona delle impostazioni (), il gestore può personalizzare in tempo reale l'aspetto visivo del player:
- Sistema a 9 Settori Flexbox: Spostamento magnetico degli elementi (Badge titolo, dati meteo, orologio, logo) nei 9 quadranti dello schermo senza rischio di sovrapposizioni.
- Logo Stazione: Upload ed eliminazione guidata del logo trasparente della propria stazione (PNG/SVG).
- Testo Libero: Inserimento di una dicitura personalizzata posizionabile a piacere (es. Quota 1.250 m s.l.m. o nome sponsor).
- Scala Dimensionale: Regolazione indipendente delle dimensioni (da 80% a 140%) per ciascun elemento grafico.
7. Network
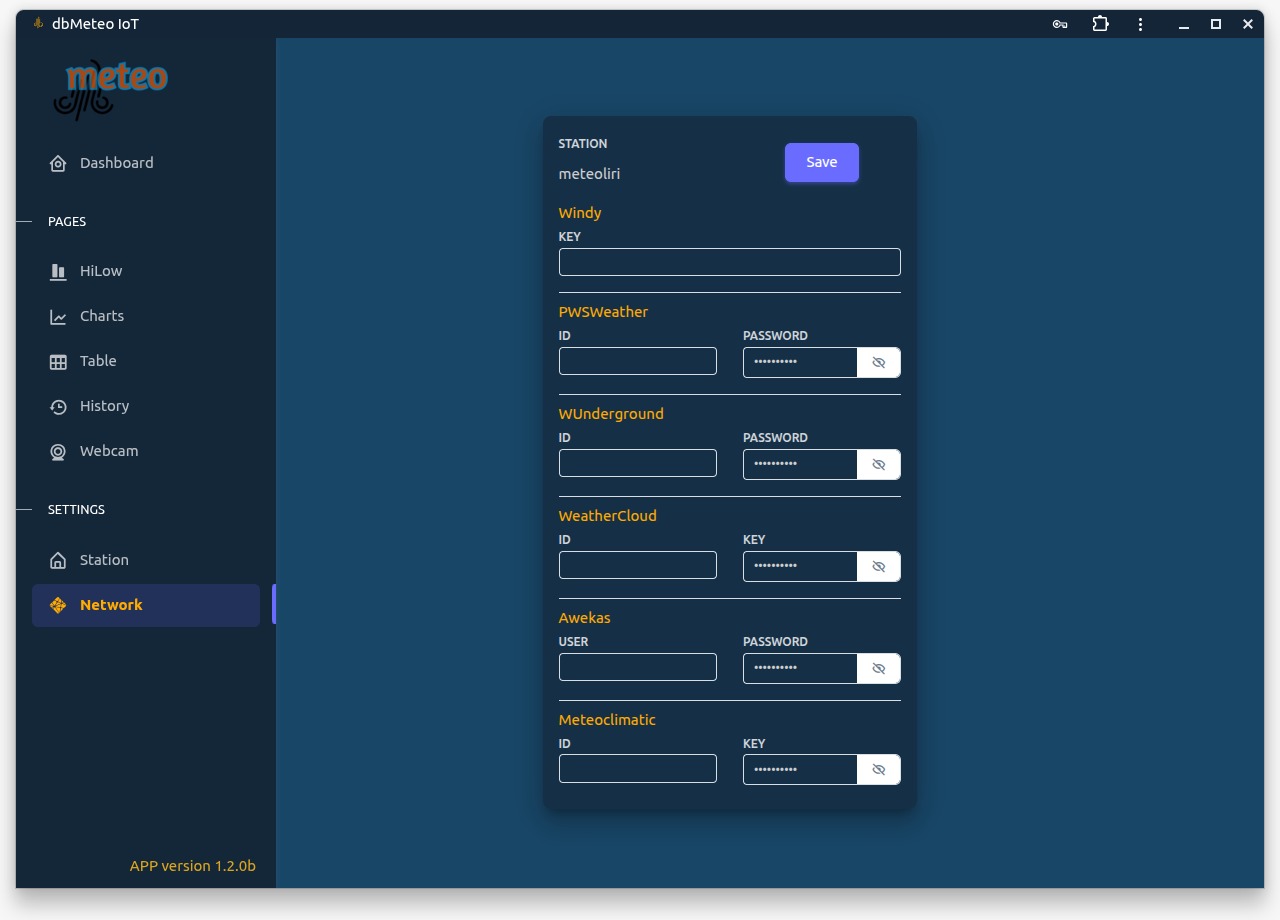 Zoom
Zoom
Configurazione export automatico verso reti esterne (WU, Windy, Awekas, ecc.).
💻 The Software (WebAPP)
Control panel, data analysis, and Cloud station management.
Zoom
The core of the system is accessible via browser at www.dbmeteo.it or through the installed WebAPP.
Developed as a PWA (Progressive Web App), the software offers an experience identical to a native app but without going through app stores. Once installed, the app launches in full screen, without navigation bars.
2. Account Creation and Configuration
Zoom
Open the installed WebAPP (or go to www.dbmeteo.it) and click on Create an account.
- Station: Choose an identifying name for your station (e.g. bustoarsizio, all lowercase). This will be your unique ID for the entire system.
- Email: Enter a valid address to receive the activation link and system notifications.
- Password: Create a secure password (10 characters) or click on auto to generate a random, strong one.
After clicking Register, check your inbox and click the confirmation link to activate the user.
Station Section (Profile)
Zoom
After your first login, access the Station menu to configure your location's parameters:
- Email address: Reference email address for system communications.
- Name: First and last name of the station manager (e.g. Mario Rossi).
- City: City or location where the station is installed.
- Lat / Lon: Exact decimal coordinates. Fundamental for establishing the time zone and correct calculation of solar data (Sunrise/Sunset).
- Depth name: Custom label to display for the depth sensor (e.g. Snow gauge).
- Webcam: URL of a static JPG image to fetch and display in the Webcam section.
- Formats and Units: Configure the time format (12/24h), language, and preferred measurement units for Temperature, Barometer, Wind, Rain, and Altitude.
- Event: Time in hours (2, 12, or 24) after which a rain event is considered finished.
3. The Interactive Dashboard
The dashboard is the main command center. Thanks to the icon system and Poppers, you can monitor real-time data without overcrowding the interface.
User Popper (System Status)
Zoom
Clicking on the user icon in the top right reveals an immediate diagnostic menu:
- Online Status: Green circle for updated data (recent reception), red if the module is not communicating properly.
- Hardware Stats: Time since last restart (Uptime), battery voltage, WiFi or LTE signal strength, RF radio signal, and module Firmware version.
- Logout: To safely log out of the WebAPP.
Data Popper (Sensor Details)
Zoom
Clicking on the three vertical dots present in each card (Temperature, Humidity, Pressure, Wind, etc.) opens a detail popper showing:
- Trend: Extended visualization of the specific parameter.
- Extra Data: Additional information related to the selected sensor, providing deep insights without taking up precious space in the main view.
Rain Data Popper (Rain Details)
Zoom
This popper offers an advanced view of hydrometry:
- Event Accumulation: The total rain fallen in the current event, automatically separated based on the time interval set in the Station settings.
- Rain Rate: Maximum recorded intensity.
- History: Direct comparison between current daily accumulation and the previous day's.
4-Hours Charts (Quick Graphs)
Zoom
In the central part of the dashboard, the charts of the last four hours for all sampled parameters are always visible.
These charts are interactive: by hovering the mouse over the trace (or tapping with your finger), you can read the exact value of each point on the time series, allowing you to monitor rapid weather changes or recent wind gusts.
4. Data Analysis (HiLow & Charts)
Zoom
HiLow (Extremes)
Record table for Today, Month, Year, and All-Time with date and time.
Zoom
Charts (Historical Graphs)
Zoomable historical analysis for 24H, 48H, 7D, 28D, and 365D.
5. History Management (Table & History)
Zoom
Table (Detailed Log)
5-minute log. Ability to delete rows (X) or edit values by clicking on the cells.
Zoom
History
Daily, monthly, and yearly summaries.
6. Streaming (Live & Time Machine)
Zoom
Live Webcam, History & Video Timelapse
The Streaming section of the WebAPP is your station's video control center. It integrates a high-performance proprietary player combining panoramic video with real-time weather telemetry.
- Low-Latency HLS Live: Smooth real-time video playback with an overlay of current weather metrics (temperature, wind, rain, pressure, humidity) and a synchronized clock.
- Time Machine (24h Interactive Timeline): Rewind the past 24 hours using the slider or quick buttons (-2h, -6h, -24h, NOW). Weather metrics update dynamically for each archived frame.
- WebAPP Exclusive - MP4 Timelapse Export: Download rendered H.264 MP4 videos directly, selecting your time range (2, 6, 12, 24 hours or custom sliders) and framerate (10, 15, or 25 FPS).
- Full UI Customization: Adjust overlay placement across a 9-quadrant flexbox grid, upload your station logo, and set custom badges (elevation or sponsor).
7. Network
Zoom
Configuration for automatic export to external networks (WU, Windy, Awekas, etc.).
💻 Le Logiciel (WebAPP)
Panneau de contrôle, analyse des données et gestion de la station dans le Cloud.
Zoom
Le cœur du système est accessible via un navigateur à l'adresse www.dbmeteo.it ou via la WebAPP installée.
Développé comme une PWA (Progressive Web App), le logiciel offre une expérience identique à une application native mais sans passer par les stores. Une fois installée, l'application se lance en plein écran, sans barres de navigation.
2. Création de Compte et Configuration
Zoom
Ouvrez la WebAPP installée (ou allez sur www.dbmeteo.it) et cliquez sur Create an account.
- Station : Choisissez un nom d'identification pour votre station (ex. bustoarsizio, tout en minuscules). Ce sera votre identifiant unique pour tout le système.
- Email : Saisissez une adresse valide pour recevoir le lien d'activation et les notifications du système.
- Password : Créez un mot de passe sécurisé (10 caractères) ou cliquez sur auto pour en générer un de manière aléatoire et robuste.
Après avoir cliqué sur Register, vérifiez votre boîte de réception et cliquez sur le lien de confirmation pour activer l'utilisateur.
Section Station (Profil)
Zoom
Après votre première connexion, accédez au menu Station pour configurer les paramètres de votre emplacement :
- Email address : Adresse e-mail de référence pour les communications du système.
- Name : Prénom et nom du gestionnaire de la station (ex. Mario Rossi).
- City : Ville ou lieu où la station est installée.
- Lat / Lon : Coordonnées décimales exactes. Fondamentales pour établir le fuseau horaire et le calcul correct des données solaires (Lever/Coucher du soleil).
- Depth name : Étiquette personnalisée à afficher pour le capteur de profondeur (ex. Nivomètre).
- Webcam : URL d'une image JPG statique à récupérer et afficher dans la section Webcam.
- Formats et Unités : Configurez le format de l'heure (12/24h), la langue et les unités de mesure préférées pour la Température, le Baromètre, le Vent, la Pluie et l'Altitude.
- Event : Temps en heures (2, 12 ou 24) après lequel un événement pluvieux est considéré comme terminé.
3. Le Tableau de Bord Interactif
Le tableau de bord est le centre de commande principal. Grâce au système d'icônes et de Poppers, vous pouvez surveiller les données en temps réel sans surcharger l'interface.
User Popper (État du Système)
Zoom
En cliquant sur l'icône utilisateur en haut à droite, un menu de diagnostic immédiat apparaît :
- Statut En Ligne : Cercle vert pour des données à jour (réception récente), rouge si le module ne communique pas correctement.
- Statistiques Matérielles : Temps depuis le dernier redémarrage (Uptime), tension de la batterie, force du signal WiFi ou LTE, signal radio RF et version du Firmware du module.
- Logout : Pour se déconnecter en toute sécurité de la WebAPP.
Data Popper (Détails des Capteurs)
Zoom
En cliquant sur les trois points verticaux présents sur chaque carte (Température, Humidité, Pression, Vent, etc.), un popper de détail s'ouvre, montrant :
- Tendance : Visualisation étendue du paramètre spécifique.
- Données Supplémentaires : Informations additionnelles liées au capteur sélectionné, garantissant une lecture approfondie sans occuper d'espace précieux sur la vue principale.
Rain Data Popper (Détails de la Pluie)
Zoom
Ce popper offre une vision avancée de l'hydrométrie :
- Cumul de l'Événement : Le total de pluie tombée lors de l'événement en cours, automatiquement séparé en fonction de l'intervalle de temps défini dans les paramètres Station.
- Rain Rate : Intensité maximale enregistrée.
- Historique : Comparaison directe entre le cumul quotidien actuel et celui du jour précédent.
4-Hours Charts (Graphiques Rapides)
Zoom
Dans la partie centrale du tableau de bord, les graphiques des quatre dernières heures pour tous les paramètres échantillonnés sont toujours visibles.
Ces graphiques sont interactifs : en survolant la courbe avec la souris (ou en touchant avec le doigt), vous pouvez lire la valeur exacte de chaque point sur la série chronologique, ce qui vous permet de surveiller les changements météorologiques rapides ou les récentes rafales de vent.
4. Analyse des Données (HiLow & Charts)
Zoom
HiLow (Extrêmes)
Tableau des records pour Aujourd'hui, Mois, Année et Absolus avec date et heure.
Zoom
Charts (Graphiques Historiques)
Analyse historique zoomable pour 24H, 48H, 7J, 28J et 365J.
5. Gestion de l'Historique (Table & History)
Zoom
Table (Journal Détaillé)
Journal à 5 minutes. Possibilité de supprimer des lignes (X) ou modifier des valeurs en cliquant sur les cellules.
Zoom
History
Résumés journaliers, mensuels et annuels.
6. Streaming (Live & Time Machine)
Zoom
Webcam Live, Historique & Vidéo Timelapse
La section Streaming de la WebAPP est le centre de contrôle vidéo de votre station. Elle intègre un lecteur performant combinant vidéo panoramique et télémétrie météo en direct.
- Direct HLS Faible Latence : Lecture vidéo fluide avec incrustation des données météo en direct et horloge synchronisée.
- Time Machine (Timeline 24h) : Remontez les dernières 24 heures avec le curseur (-2h, -6h, -24h, MAINTENANT). Les données météo s'actualisent instantanément pour chaque image.
- Exclusivité WebAPP - Export Timelapse MP4 : Téléchargez des vidéos MP4 (H.264) générées à la demande, en choisissant l'intervalle horaire et la vitesse (10, 15 ou 25 FPS).
- Personnalisation Graphique Complète : Disposition sur une grille à 9 quadrants, téléversement de votre logo et badge de texte libre (altitude ou sponsor).
7. Réseau (Network)
Zoom
Configuration pour l'exportation automatique vers des réseaux externes (WU, Windy, Awekas, etc.).
💻 El Software (WebAPP)
Panel de control, análisis de datos y gestión de la estación en la Nube.
Zoom
El núcleo del sistema es accesible vía navegador en www.dbmeteo.it o a través de la WebAPP instalada.
Desarrollado como PWA (Progressive Web App), el software ofrece una experiencia idéntica a la de una aplicación nativa pero sin pasar por las tiendas de aplicaciones. Una vez instalada, la app se inicia a pantalla completa, sin barras de navegación.
2. Creación de Cuenta y Configuración
Zoom
Abre la WebAPP instalada (o entra en www.dbmeteo.it) y haz clic en Create an account.
- Station: Elige un nombre identificativo para tu estación (ej. bustoarsizio, todo en minúsculas). Este será tu ID único para todo el sistema.
- Email: Introduce una dirección válida para recibir el enlace de activación y notificaciones del sistema.
- Password: Crea una contraseña segura (10 caracteres) o haz clic en auto para generar una robusta al azar.
Tras hacer clic en Register, comprueba tu bandeja de entrada y haz clic en el enlace de confirmación para activar el usuario.
Sección Station (Perfil)
Zoom
Después del primer inicio de sesión, accede al menú Station para configurar los parámetros de tu ubicación:
- Email address: Dirección de correo electrónico de referencia para las comunicaciones del sistema.
- Name: Nombre y apellidos del gestor de la estación (ej. Mario Rossi).
- City: Ciudad o localidad donde está instalada la estación.
- Lat / Lon: Coordenadas decimales exactas. Fundamentales para establecer la zona horaria y el cálculo correcto de los datos solares (Amanecer/Atardecer).
- Depth name: Etiqueta personalizada para mostrar el sensor de profundidad (ej. Nivómetro).
- Webcam: URL de una imagen JPG estática que se obtendrá y mostrará en la sección de la Webcam.
- Formatos y Unidades: Configura el formato de hora (12/24h), el idioma y las unidades de medida preferidas para Temperatura, Barómetro, Viento, Lluvia y Altitud.
- Event: Tiempo en horas (2, 12 o 24) tras el cual un evento de lluvia se considera terminado.
3. El Panel Interactivo (Dashboard)
El panel de control (dashboard) es el centro de mando principal. Gracias al sistema de iconos y Poppers, puedes monitorizar los datos en tiempo real sin sobrecargar la interfaz.
User Popper (Estado del Sistema)
Zoom
Al hacer clic en el icono de usuario arriba a la derecha, aparece un menú de diagnóstico inmediato:
- Estado Online: Círculo verde para datos actualizados (recepción reciente), rojo si el módulo no se comunica correctamente.
- Estadísticas de Hardware: Tiempo desde el último reinicio (Uptime), voltaje de la batería, intensidad de la señal WiFi o LTE, señal de radio RF y versión de Firmware del módulo.
- Logout: Para cerrar sesión de forma segura en la WebAPP.
Data Popper (Detalle de Sensores)
Zoom
Haciendo clic en los tres puntos verticales presentes en cada tarjeta (Temperatura, Humedad, Presión, Viento, etc.), se abre un popper de detalle que muestra:
- Tendencia: Visualización ampliada del parámetro específico.
- Datos Extra: Información adicional relacionada con el sensor seleccionado, garantizando una lectura profunda sin ocupar espacio valioso en la vista principal.
Rain Data Popper (Detalle de Lluvia)
Zoom
Este popper ofrece una visión avanzada de la hidrometría:
- Acumulación del Evento: El total de lluvia caída en el evento actual, separado automáticamente según el intervalo de tiempo establecido en los ajustes de Station.
- Rain Rate: Intensidad máxima registrada.
- Historial: Comparación directa entre la acumulación diaria actual y la del día anterior.
4-Hours Charts (Gráficos Rápidos)
Zoom
En la parte central del panel siempre están visibles los gráficos de las últimas cuatro horas para todos los parámetros muestreados.
Estos gráficos son interactivos: al pasar el ratón sobre el trazo (o tocar con el dedo) es posible leer el valor exacto de cada punto en la serie temporal, permitiendo monitorizar cambios rápidos del clima o ráfagas de viento recientes.
4. Análisis de Datos (HiLow & Charts)
Zoom
HiLow (Extremos)
Tabla de récords para Hoy, Mes, Año y Absolutos con fecha y hora.
Zoom
Charts (Gráficos Históricos)
Análisis histórico con zoom para 24H, 48H, 7D, 28D y 365D.
5. Gestión del Historial (Table & History)
Zoom
Table (Registro Detallado)
Registro (log) de 5 minutos. Posibilidad de eliminar filas (X) o modificar valores haciendo clic en las celdas.
Zoom
History
Resúmenes diarios, mensuales y anuales.
6. Streaming (Live y Time Machine)
Zoom
Webcam en Vivo, Historial y Video Timelapse
La sección Streaming de la WebAPP es el centro de control de video de tu estación. Integra un reproductor de alto rendimiento que combina video panorámico con telemetría en tiempo real.
- Directo HLS de Baja Latencia: Video en vivo con superposición de datos meteorológicos y reloj sincronizado.
- Time Machine (Línea de tiempo 24h): Retrocede las últimas 24 horas con el deslizador (-2h, -6h, -24h, AHORA). Los datos climáticos se actualizan para cada fotograma.
- Exclusiva WebAPP - Descarga Timelapse MP4: Genera y descarga videos MP4 (H.264) eligiendo el rango de horas y la velocidad (10, 15 o 25 FPS).
- Personalización Visual: Ubicación magnética en 9 cuadrantes, carga del logo de tu estación y texto libre (altitud o patrocinador).
7. Red (Network)
Zoom
Configuración para exportación automática hacia redes externas (WU, Windy, Awekas, etc.).
💻 Die Software (WebAPP)
Bedienfeld, Datenanalyse und Verwaltung der Cloud-Station.
Zoom
Das Herzstück des Systems ist über den Browser unter www.dbmeteo.it oder über die installierte WebAPP erreichbar.
Entwickelt als PWA (Progressive Web App), bietet die Software ein identisches Erlebnis wie eine native App, jedoch ohne über die Stores gehen zu müssen. Nach der Installation startet die App im Vollbildmodus, ohne Navigationsleisten.
2. Kontoerstellung und Konfiguration
Zoom
Öffnen Sie die installierte WebAPP (oder gehen Sie zu www.dbmeteo.it) und klicken Sie auf Create an account.
- Station: Wählen Sie einen identifizierenden Namen für Ihre Station (z.B. bustoarsizio, alles in Kleinbuchstaben). Dies wird Ihre eindeutige ID für das gesamte System sein.
- Email: Geben Sie eine gültige Adresse ein, um den Aktivierungslink und Systembenachrichtigungen zu erhalten.
- Password: Erstellen Sie ein sicheres Passwort (10 Zeichen) oder klicken Sie auf auto, um ein zufälliges und starkes zu generieren.
Nachdem Sie auf Register geklickt haben, überprüfen Sie Ihren Posteingang und klicken Sie auf den Bestätigungslink, um den Benutzer zu aktivieren.
Bereich Station (Profil)
Zoom
Nach Ihrem ersten Login greifen Sie auf das Menü Station zu, um die Parameter Ihres Standorts zu konfigurieren:
- Email address: Referenz-E-Mail-Adresse für Systemkommunikationen.
- Name: Vor- und Nachname des Stationsmanagers (z.B. Mario Rossi).
- City: Stadt oder Ort, an dem die Station installiert ist.
- Lat / Lon: Genaue Dezimalkoordinaten. Grundlegend für die Festlegung der Zeitzone und die korrekte Berechnung der Solardaten (Sonnenaufgang/Sonnenuntergang).
- Depth name: Benutzerdefiniertes Label, das für den Tiefensensor angezeigt werden soll (z.B. Schneemesser).
- Webcam: URL eines statischen JPG-Bildes, das abgerufen und im Webcam-Bereich angezeigt werden soll.
- Formate und Einheiten: Konfigurieren Sie das Zeitformat (12/24h), die Sprache und die bevorzugten Maßeinheiten für Temperatur, Barometer, Wind, Regen und Höhe.
- Event: Zeit in Stunden (2, 12 oder 24), nach der ein Regenereignis als beendet gilt.
3. Das interaktive Dashboard
Das Dashboard ist das Hauptkommandozentrum. Dank des Icon-Systems und der Popper können Sie Daten in Echtzeit überwachen, ohne die Benutzeroberfläche zu überladen.
User Popper (Systemstatus)
Zoom
Ein Klick auf das Benutzersymbol oben rechts öffnet ein sofortiges Diagnosemenü:
- Online-Status: Grüner Kreis für aktualisierte Daten (kürzlicher Empfang), rot, wenn das Modul nicht richtig kommuniziert.
- Hardware-Statistiken: Zeit seit dem letzten Neustart (Uptime), Batteriespannung, LTE or WLAN-Signalstärke, RF-Funksignal und Firmware-Version des Moduls.
- Logout: Um sich sicher aus der WebAPP abzumelden.
Data Popper (Sensordetails)
Zoom
Ein Klick auf die drei vertikalen Punkte auf jeder Karte (Temperatur, Luftfeuchtigkeit, Druck, Wind usw.) öffnet einen Detail-Popper, der Folgendes anzeigt:
- Trend: Erweiterte Visualisierung des spezifischen Parameters.
- Extra-Daten: Zusätzliche Informationen zum ausgewählten Sensor, die tiefe Einblicke gewähren, ohne wertvollen Platz in der Hauptansicht zu beanspruchen.
Rain Data Popper (Regendetails)
Zoom
Dieser Popper bietet eine erweiterte Ansicht der Hydrometrie:
- Ereignis-Akkumulation: Der Gesamtniederschlag während des aktuellen Ereignisses, automatisch getrennt basierend auf dem in den Station-Einstellungen festgelegten Zeitintervall.
- Rain Rate: Maximal aufgezeichnete Intensität.
- Historie: Direkter Vergleich zwischen der aktuellen täglichen Akkumulation und der des Vortages.
4-Hours Charts (Schnellgrafiken)
Zoom
Im mittleren Teil des Dashboards sind stets die Grafiken der letzten vier Stunden für alle abgetasteten Parameter sichtbar.
Diese Grafiken sind interaktiv: Indem Sie mit der Maus über die Linie fahren (oder mit dem Finger tippen), können Sie den genauen Wert jedes Punktes auf der Zeitreihe ablesen. Dies ermöglicht die Überwachung schneller Wetterumschwünge oder kürzlicher Windböen.
4. Datenanalyse (HiLow & Charts)
Zoom
HiLow (Extreme)
Rekordtabelle für Heute, Monat, Jahr und Absolut mit Datum und Uhrzeit.
Zoom
Charts (Historische Grafiken)
Zoomfähige historische Analyse für 24H, 48H, 7T, 28T und 365T.
5. Historienverwaltung (Table & History)
Zoom
Table (Detailliertes Log)
5-Minuten-Log. Möglichkeit, Zeilen zu löschen (X) oder Werte zu ändern, indem man auf die Zellen klickt.
Zoom
History
Tägliche, monatliche und jährliche Zusammenfassungen.
6. Streaming (Live & Time Machine)
Zoom
Live-Webcam, Archiv & Zeitraffer-Video
Der Bereich Streaming der WebAPP ist die Videozentrale Ihrer Station. Er vereint Panoramavideo mit Echtzeit-Wettertelemetrie.
- HLS-Livestream mit geringer Latenz: Flüssige Echtzeitwiedergabe mit eingeblendeten Wetterdaten und synchronisierter Uhrzeit.
- Time Machine (Interaktive 24h-Zeitleiste): Blättern Sie per Schieberegler durch die letzten 24 Stunden (-2h, -6h, -24h, JETZT). Wetterdaten synchronisieren sich mit jedem Bild.
- WebAPP-Exklusiv - MP4-Zeitraffer-Export: Laden Sie MP4-Videos (H.264) herunter mit freier Wahl des Zeitbereichs und der Bildrate (10, 15 oder 25 FPS).
- Volle Oberflächen-Anpassung: Platzierung über 9 Quadranten, Stationslogo-Upload und benutzerdefinierte Texte (Höhe oder Sponsor).
7. Netzwerk (Network)
Zoom
Konfiguration für den automatischen Export an externe Netzwerke (WU, Windy, Awekas usw.).
🌐 Il Tuo Sito Pubblico
Un portale meteorologico moderno, performante e completamente automatizzato, pronto all'uso.
Ogni stazione dbMeteo ha a disposizione un proprio sito web pubblico personalizzato (es: accountstazione.dbmeteo.it). Non è richiesta alcuna configurazione server: il sito è "chiavi in mano" e si aggiorna automaticamente con i dati in tempo reale. Puoi testare le potenzialità del portale sulla nostra demo ufficiale.
Il portale è progettato per un'utenza internazionale: il visitatore può cambiare lingua in tempo reale (Italiano / Inglese) tramite l'apposita pulsantiera, rendendo i dati della tua stazione accessibili a chiunque nel mondo.
Analisi Tecnica e Parametri Avanzati
Il sito pubblico non si limita a visualizzare i dati grezzi dei sensori, ma esegue elaborazioni complesse lato server. Il nostro motore calcola in tempo reale indici meteorologici avanzati per offrire un quadro climatico completo:
- Indici di Benessere: Il software elabora autonomamente il Dew Point (Punto di rugiada), l'Heat Index (Indice di calore) e il Wind Chill (Sensazione termica dovuta al vento).
- Guida all'utente (Tooltip): Ogni parametro avanzato è accompagnato da tooltip informativi. Basta cliccare o passare il mouse sulle icone informative per leggere una spiegazione semplice e chiara di cosa rappresenta quel dato e perché è importante.
- Base Nubi: Stima automatica dell'altezza della base delle nubi, calcolata analizzando il gradiente termico e l'umidità.
- Densità dell'aria: Calcolo dinamico essenziale per attività tecniche o sportive.
- Astronomia dinamica: Visualizzazione grafica delle fasi lunari, orari di alba/tramonto e zenit solare calcolati sulla posizione GPS della stazione.
Caratteristiche distintive
🎨 Design Multi-Tema
L'interfaccia si adatta ai gusti dell'utente con tre modalità cromatiche: OLED (massimo contrasto), Night (luce soffusa) e Paper (stile classico). La scelta viene memorizzata automaticamente.
📊 Dashboard e Grafici
Widget interattivi con serie storiche a 24H, 48H, 7gg, 28gg e 365gg. Il sistema gestisce nativamente la doppia scala (es. Temp/Umidità o Vento/Direzione) e una Rosa dei Venti dinamica.
📈 Estremi e Storico (HiLow)
Vista dedicata agli estremi per analizzare i record giornalieri, mensili e storici, con evidenza dell'orario preciso in cui è stato registrato ogni valore massimo o minimo.
🎥 Webcam Live & Time Machine
Se la postazione ha una telecamera, il portale attiva automaticamente la sezione Live Stream: un player panoramico HLS a bassa latenza che permette ai visitatori di guardare la diretta o riavvolgere le ultime 24 ore per rivedere l'evoluzione meteo della giornata.
Previsioni e Dettaglio Orario
Il portale integra strumenti di analisi previsionale basati sulle coordinate GPS della tua installazione:
- Home Forecast: Un cursore orario in dashboard per visualizzare l'evoluzione meteo nelle prossime 24 ore.
- Forecast 6 giorni: Previsioni dettagliate con icone dinamiche (basate su API Open-Meteo) per pianificare la settimana.
- Mappa Radar: Integrazione interattiva Windy.com centrata sulla tua posizione per monitorare piogge e fronti in tempo reale.
Navigazione senza compromessi
L'esperienza utente è stata studiata per essere fluida e immediata:
- Aggiornamenti in tempo reale (Live): Non serve ricaricare la pagina! I dati della tua stazione arrivano sul sito pubblico in tempo reale, garantendo una precisione millimetrica durante eventi meteo significativi.
- Performance PWA: Il sito pubblico, essendo una Progressive Web App, può essere "installato" dai tuoi visitatori sullo smartphone, diventando un'app meteo personalizzata dedicata esclusivamente alla tua località.
- Accessibilità Universale: Il sito si adatta perfettamente a qualsiasi risoluzione, dal monitor ultra-wide del PC allo smartphone più piccolo, garantendo sempre la massima leggibilità.
- Streaming Intelligente e Mobile-First: Pensato per chi naviga da smartphone. Su schermi piccoli compare un pulsante rapido per ruotare lo schermo a 90° e godersi il panorama a tutto schermo. Inoltre, per non consumare la connessione dati del visitatore, il flusso video non parte mai da solo in background e si disattiva dopo 60 secondi di inattività.
💡 Nota per il Gestore
Puoi collegare il tuo dominio personalizzato al portale tramite una configurazione CNAME (puntando a accountstazione.dbmeteo.it). Il sito manterrà il tuo brand, sfruttando la stabilità e la potenza dell'infrastruttura Cloud dbMeteo.
🌐 Your Public Website
A modern, high-performance, and fully automated weather portal, ready to use.
Every dbMeteo station has its own personalized public website (e.g., stationaccount.dbmeteo.it). No server configuration is required: the site is "turnkey" and updates automatically with real-time data. You can test the portal's potential on our official demo.
The portal is designed for an international audience: visitors can change the language in real-time (Italian / English) using the dedicated buttons, making your station's data accessible to anyone in the world.
Technical Analysis and Advanced Parameters
The public site doesn't just display raw sensor data; it performs complex server-side processing. Our engine calculates advanced meteorological indices in real-time to offer a complete climate picture:
- Comfort Indices: The software autonomously processes the Dew Point, Heat Index, and Wind Chill.
- User Guide (Tooltips): Each advanced parameter is accompanied by informative tooltips. Just click or hover over the info icons to read a simple and clear explanation of what that data represents and why it's important.
- Cloud Base: Automatic estimation of the cloud base height, calculated by analyzing the thermal gradient and humidity.
- Air Density: Dynamic calculation essential for technical or sporting activities.
- Dynamic Astronomy: Graphical display of moon phases, sunrise/sunset times, and solar zenith calculated based on the station's GPS position.
Distinctive Features
🎨 Multi-Theme Design
The interface adapts to user preferences with three color modes: OLED (maximum contrast), Night (soft light), and Paper (classic style). The choice is automatically saved.
📊 Dashboard and Charts
Interactive widgets with 24H, 48H, 7-day, 28-day, and 365-day historical series. The system natively handles dual scales (e.g., Temp/Humidity or Wind/Direction) and a dynamic Wind Rose.
📈 Extremes and History (HiLow)
Dedicated extremes view to analyze daily, monthly, and historical records, highlighting the exact time each maximum or minimum value was recorded.
🎥 Live Webcam & Time Machine
If your station has a camera, the portal automatically enables the Live Stream section: an ultra-responsive low-latency HLS player allowing visitors to watch live or rewind the past 24 hours.
Forecasts and Hourly Details
The portal integrates forecasting tools based on your installation's GPS coordinates:
- Home Forecast: An hourly slider on the dashboard to view the weather evolution over the next 24 hours.
- 6-Day Forecast: Detailed forecasts with dynamic icons (based on the Open-Meteo API) to plan your week.
- Radar Map: Interactive Windy.com integration centered on your location to monitor rain and weather fronts in real-time.
Uncompromising Navigation
The user experience has been designed to be fluid and immediate:
- Real-time updates (Live): No need to reload the page! Your station's data arrives on the public site in real-time, ensuring pinpoint accuracy during significant weather events.
- PWA Performance: Being a Progressive Web App, the public site can be "installed" by your visitors on their smartphones, becoming a custom weather app dedicated exclusively to your location.
- Universal Accessibility: The site adapts perfectly to any resolution, from ultra-wide PC monitors to the smallest smartphones, always ensuring maximum readability.
- Smart, Mobile-First Streaming: Designed for smartphones. In portrait mode, a quick-action button rotates to horizontal fullscreen. Streaming only loads when opened and turns off after 60 seconds of inactivity to protect visitor mobile data.
💡 Manager Note
You can connect your custom domain to the portal via a CNAME configuration (pointing to stationaccount.dbmeteo.it). The site will keep your brand, leveraging the stability and power of the dbMeteo Cloud infrastructure.
🌐 Votre Site Public
Un portail météorologique moderne, performant et entièrement automatisé, prêt à l'emploi.
Chaque station dbMeteo dispose de son propre site web public personnalisé (ex: comptestation.dbmeteo.it). Aucune configuration de serveur n'est requise : le site est "clé en main" et se met à jour automatiquement avec des données en temps réel. Vous pouvez tester le potentiel du portail sur notre démo officielle.
Le portail est conçu pour un public international : le visiteur peut changer de langue en temps réel (Italien / Anglais) via les boutons dédiés, rendant les données de votre station accessibles à tous dans le monde.
Analyse Technique et Paramètres Avancés
Le site public ne se contente pas d'afficher les données brutes des capteurs, mais effectue des traitements complexes côté serveur. Notre moteur calcule en temps réel des indices météorologiques avancés pour offrir un tableau climatique complet :
- Indices de Confort : Le logiciel traite de manière autonome le Dew Point (Point de rosée), le Heat Index (Indice de chaleur) et le Wind Chill (Refroidissement éolien).
- Guide de l'utilisateur (Infobulles) : Chaque paramètre avancé est accompagné d'infobulles informatives. Il suffit de cliquer ou de survoler les icônes d'information pour lire une explication simple et claire de ce que représente cette donnée et pourquoi elle est importante.
- Base des Nuages : Estimation automatique de la hauteur de la base des nuages, calculée en analysant le gradient thermique et l'humidité.
- Densité de l'air : Calcul dynamique essentiel pour les activités techniques ou sportives.
- Astronomie dynamique : Affichage graphique des phases de la lune, des heures de lever/coucher du soleil et du zénith solaire calculés sur la position GPS de la station.
Caractéristiques distinctives
🎨 Design Multi-Thème
L'interface s'adapte aux goûts de l'utilisateur avec trois modes de couleurs : OLED (contraste maximum), Night (lumière douce) et Paper (style classique). Le choix est mémorisé automatiquement.
📊 Tableau de Bord et Graphiques
Widgets interactifs avec séries historiques sur 24H, 48H, 7j, 28j et 365j. Le système gère nativement la double échelle (ex. Temp/Humidité ou Vent/Direction) et une Rose des Vents dynamique.
📈 Extrêmes et Historique (HiLow)
Vue dédiée aux extrêmes pour analyser les records quotidiens, mensuels et historiques, en mettant en évidence l'heure précise à laquelle chaque valeur maximale ou minimale a été enregistrée.
🎥 Webcam Live & Time Machine
Si la station possède une caméra, le portail active automatiquement la section Live Stream : un lecteur HLS fluide permettant aux visiteurs de regarder le direct ou de remonter les dernières 24 heures.
Prévisions et Détails Horaires
Le portail intègre des outils d'analyse prévisionnelle basés sur les coordonnées GPS de votre installation :
- Home Forecast : Un curseur horaire sur le tableau de bord pour visualiser l'évolution météo dans les 24 prochaines heures.
- Forecast 6 jours : Prévisions détaillées avec icônes dynamiques (basées sur l'API Open-Meteo) pour planifier la semaine.
- Carte Radar : Intégration interactive de Windy.com centrée sur votre position pour surveiller les pluies et les fronts en temps réel.
Navigation sans compromis
L'expérience utilisateur a été étudiée pour être fluide et immédiate :
- Mises à jour en temps réel (Live) : Pas besoin de recharger la page ! Les données de votre station arrivent sur le site public en temps réel, garantissant une précision millimétrique lors d'événements météo importants.
- Performance PWA : Le site public, étant une Progressive Web App, peut être "installé" par vos visiteurs sur leur smartphone, devenant une application météo personnalisée dédiée exclusivement à votre localité.
- Accessibilité Universelle : Le site s'adapte parfaitement à n'importe quelle résolution, du moniteur PC ultra-large au plus petit smartphone, garantissant toujours une lisibilité maximale.
- Streaming Intelligent et Mobile-First : Sur smartphone, un bouton rapide permet de basculer en plein écran horizontal. Le flux ne se lance que lorsque l'onglet est ouvert et s'arrête après 60 secondes d'inactivité pour économiser les données mobiles des visiteurs.
💡 Note pour le Gestionnaire
Vous pouvez lier votre domaine personnalisé au portail via une configuration CNAME (pointant vers comptestation.dbmeteo.it). Le site conservera votre marque, en exploitant la stabilité et la puissance de l'infrastructure Cloud dbMeteo.
🌐 Tu Sitio Público
Un portal meteorológico moderno, de alto rendimiento y completamente automatizado, listo para usar.
Cada estación dbMeteo tiene su propio sitio web público personalizado (ej: cuentaestacion.dbmeteo.it). No se requiere configuración del servidor: el sitio es "llave en mano" y se actualiza automáticamente con datos en tiempo real. Puedes probar el potencial del portal en nuestra demo oficial.
El portal está diseñado para un público internacional: el visitante puede cambiar el idioma en tiempo real (Italiano / Inglés) mediante los botones correspondientes, haciendo que los datos de tu estación sean accesibles para cualquier persona en el mundo.
Análisis Técnico y Parámetros Avanzados
El sitio público no se limita a mostrar los datos brutos de los sensores, sino que realiza procesamientos complejos del lado del servidor. Nuestro motor calcula en tiempo real índices meteorológicos avanzados para ofrecer un panorama climático completo:
- Índices de Confort: El software procesa de forma autónoma el Dew Point (Punto de rocío), el Heat Index (Índice de calor) y el Wind Chill (Sensación térmica por viento).
- Guía del usuario (Tooltips): Cada parámetro avanzado va acompañado de tooltips informativos. Solo haz clic o pasa el ratón sobre los iconos de información para leer una explicación simple y clara de lo que representa ese dato y por qué es importante.
- Base de Nubes: Estimación automática de la altura de la base de las nubes, calculada analizando el gradiente térmico y la humedad.
- Densidad del aire: Cálculo dinámico esencial para actividades técnicas o deportivas.
- Astronomía dinámica: Visualización gráfica de las fases lunares, horarios de amanecer/atardecer y cenit solar calculados sobre la posición GPS de la estación.
Características distintivas
🎨 Diseño Multi-Tema
La interfaz se adapta a los gustos del usuario con tres modos cromáticos: OLED (máximo contraste), Night (luz suave) y Paper (estilo clásico). La elección se guarda automáticamente.
📊 Dashboard y Gráficos
Widgets interactivos con series históricas a 24H, 48H, 7 días, 28 días y 365 días. El sistema maneja de forma nativa la doble escala (ej. Temp/Humedad o Viento/Dirección) y una Rosa de los Vientos dinámica.
📈 Extremos e Historial (HiLow)
Vista dedicada a los extremos para analizar los récords diarios, mensuales e históricos, destacando la hora precisa en la que se registró cada valor máximo o mínimo.
🎥 Webcam en Vivo y Time Machine
Si la estación dispone de cámara, el portal habilita automáticamente la sección Live Stream: un reproductor HLS de baja latencia para ver el directo o retroceder las últimas 24 horas.
Previsiones y Detalle Horario
El portal integra herramientas de análisis de previsión basadas en las coordenadas GPS de tu instalación:
- Home Forecast: Un control deslizante horario en el dashboard para ver la evolución del clima en las próximas 24 horas.
- Forecast 6 días: Previsiones detalladas con iconos dinámicos (basados en la API de Open-Meteo) para planificar la semana.
- Mapa Radar: Integración interactiva de Windy.com centrada en tu ubicación para monitorizar lluvias y frentes en tiempo real.
Navegación sin compromisos
La experiencia del usuario ha sido diseñada para ser fluida e inmediata:
- Actualizaciones en tiempo real (Live): ¡No necesitas recargar la página! Los datos de tu estación llegan al sitio público en tiempo real, garantizando una precisión milimétrica durante eventos climáticos significativos.
- Rendimiento PWA: El sitio público, al ser una Progressive Web App, puede ser "instalado" por tus visitantes en sus smartphones, convirtiéndose en una app del clima personalizada dedicada exclusivamente a tu localidad.
- Accesibilidad Universal: El sitio se adapta perfectamente a cualquier resolución, desde monitores ultra anchos de PC hasta el smartphone más pequeño, garantizando siempre la máxima legibilidad.
- Streaming Inteligente y Mobile-First: En smartphones en vertical, un botón rápido gira la pantalla a pantalla completa horizontal. La transmisión no se descarga en segundo plano y se apaga tras 60 segundos de inactividad para no gastar los datos móviles de los visitantes.
💡 Nota para el Gestor
Puedes vincular tu dominio personalizado al portal mediante una configuración CNAME (apuntando a cuentaestacion.dbmeteo.it). El sitio mantendrá tu marca, aprovechando la estabilidad y potencia de la infraestructura Cloud dbMeteo.
🌐 Ihre öffentliche Website
Ein modernes, leistungsstarkes und vollautomatisiertes Wetterportal, sofort einsatzbereit.
Jede dbMeteo-Station verfügt über eine eigene, personalisierte öffentliche Website (z. B. stationskonto.dbmeteo.it). Es ist keine Serverkonfiguration erforderlich: Die Seite ist "schlüsselfertig" und aktualisiert sich automatisch mit Echtzeitdaten. Sie können das Potenzial des Portals in unserer offiziellen Demo testen.
Das Portal ist für ein internationales Publikum konzipiert: Der Besucher kann die Sprache in Echtzeit (Italienisch / Englisch) über die entsprechenden Schaltflächen ändern, sodass die Daten Ihrer Station für jeden auf der Welt zugänglich sind.
Technische Analyse und erweiterte Parameter
Die öffentliche Website zeigt nicht nur rohe Sensordaten an, sondern führt komplexe serverseitige Verarbeitungen durch. Unsere Engine berechnet in Echtzeit erweiterte meteorologische Indizes, um ein vollständiges Klimabild zu bieten:
- Komfortindizes: Die Software verarbeitet autonom den Taupunkt (Dew Point), den Hitzeindex (Heat Index) und die Windkühle (Wind Chill).
- Benutzerhandbuch (Tooltips): Jeder erweiterte Parameter wird von informativen Tooltips begleitet. Klicken Sie einfach auf die Info-Symbole oder fahren Sie mit der Maus darüber, um eine einfache und klare Erklärung zu lesen, was dieser Wert darstellt und warum er wichtig ist.
- Wolkenbasis: Automatische Schätzung der Höhe der Wolkenbasis, berechnet durch Analyse des Temperaturgradienten und der Luftfeuchtigkeit.
- Luftdichte: Dynamische Berechnung, die für technische oder sportliche Aktivitäten unerlässlich ist.
- Dynamische Astronomie: Grafische Anzeige der Mondphasen, Sonnenaufgangs-/Sonnenuntergangszeiten und des Sonnenzenits, berechnet basierend auf der GPS-Position der Station.
Besondere Merkmale
🎨 Multi-Theme-Design
Die Benutzeroberfläche passt sich mit drei Farbmodi den Vorlieben des Benutzers an: OLED (maximaler Kontrast), Night (weiches Licht) und Paper (klassischer Stil). Die Auswahl wird automatisch gespeichert.
📊 Dashboard und Diagramme
Interaktive Widgets mit historischen Reihen für 24H, 48H, 7 Tage, 28 Tage und 365 Tage. Das System unterstützt nativ Doppel-Skalen (z. B. Temp/Luftfeuchtigkeit oder Wind/Richtung) und eine dynamische Windrose.
📈 Extreme und Historie (HiLow)
Spezielle Extremwertansicht zur Analyse täglicher, monatlicher und historischer Rekorde, wobei die genaue Uhrzeit hervorgehoben wird, zu der jeder Höchst- oder Mindestwert aufgezeichnet wurde.
🎥 Live-Webcam & Time Machine
Verfügt die Station über eine Kamera, aktiviert das Portal automatisch den Bereich Live Stream: Ein HLS-Player mit geringer Latenz, mit dem Besucher live zusehen oder die letzten 24 Stunden zurückspulen können.
Vorhersagen und stündliche Details
Das Portal integriert Vorhersage-Tools basierend auf den GPS-Koordinaten Ihrer Installation:
- Home Forecast: Ein stündlicher Schieberegler im Dashboard, um die Wetterentwicklung der nächsten 24 Stunden anzuzeigen.
- 6-Tage-Vorhersage: Detaillierte Vorhersagen mit dynamischen Symbolen (basierend auf der Open-Meteo-API) zur Planung Ihrer Woche.
- Radar-Karte: Interaktive Integration von Windy.com, zentriert auf Ihren Standort, um Regen und Wetterfronten in Echtzeit zu überwachen.
Kompromisslose Navigation
Das Benutzererlebnis wurde so gestaltet, dass es flüssig und unmittelbar ist:
- Echtzeit-Updates (Live): Die Seite muss nicht neu geladen werden! Die Daten Ihrer Station erreichen die öffentliche Website in Echtzeit und gewährleisten so höchste Präzision bei bedeutenden Wetterereignissen.
- PWA-Leistung: Da die öffentliche Website eine Progressive Web App ist, kann sie von Ihren Besuchern auf ihrem Smartphone "installiert" werden und wird so zu einer benutzerdefinierten Wetter-App exklusiv für Ihren Standort.
- Universelle Barrierefreiheit: Die Website passt sich perfekt an jede Auflösung an, vom Ultra-Wide-PC-Monitor bis zum kleinsten Smartphone, und garantiert stets maximale Lesbarkeit.
- Intelligentes & Mobile-First Streaming: Im Smartphone-Hochformat ermöglicht ein Schnell-Button die horizontale Vollbildansicht. Der Stream lädt nur bei aktiver Ansicht und schaltet nach 60 Sekunden Inaktivität ab, um das mobile Datenvolumen der Besucher zu schonen.
💡 Hinweis für den Betreiber
Sie können Ihre benutzerdefinierte Domain über eine CNAME-Konfiguration (die auf stationskonto.dbmeteo.it verweist) mit dem Portal verbinden. Die Seite behält Ihre Marke bei und nutzt gleichzeitig die Stabilität und Leistung der dbMeteo Cloud-Infrastruktur.
📄 Sorgente Dati (API & JSON)
I dati di dbMeteo sono esposti tramite API RESTful in formato JSON, pronti per essere integrati in siti web, domotica o applicazioni esterne.
1. Dati Live (alldata)
Il file alldata fornisce lo stato attuale della stazione: temperatura, umidità, pressione, vento, radiazione, dati astronomici e statistiche correnti.
Esempio richiesta:
https://data.dbmeteo.it/account/alldata
Parametri:
account: Identificativo della stazione
2. Dati Grafici (graphdata)
Il file graphdata contiene le serie storiche compresse per intervalli temporali: 24h (one), 48h (two), 7gg (three), 28gg (four), 365gg (five).
Esempio richiesta:
https://data.dbmeteo.it/account/graphdata
Parametri:
account: Identificativo della stazione
3. API Storico Database
È possibile interrogare il database storico passando parametri GET (Formato data: MMDDYYYY). Il sistema risponde con un array JSON di record.
Esempio richiesta:
https://data.dbmeteo.it/database.php?stat=demo&table=record&date=01012025
Parametri:
stat=: Identificativo della stazione.&table=:
- record: dati a 5 min della data selezionata
- hour: dati orari degli ultimi 28 giorni dalla data selezionata
- day dati giornalieri degli ultimi 365 giorni dalla data selezionata
- month dati mensili della data selezionata&date=: Data nel formato MMDDYYYY.
📄 Data Source (API & JSON)
dbMeteo data is exposed via RESTful APIs in JSON format, ready to be integrated into websites, home automation, or external applications.
1. Live Data (alldata)
The alldata file provides the current status of the station: temperature, humidity, pressure, wind, radiation, astronomical data, and current statistics.
Request example:
https://data.dbmeteo.it/account/alldata
Parameters:
account: Station identifier
2. Chart Data (graphdata)
The graphdata file contains compressed historical series for time intervals: 24h (one), 48h (two), 7 days (three), 28 days (four), 365 days (five).
Request example:
https://data.dbmeteo.it/account/graphdata
Parameters:
account: Station identifier
3. Historical Database API
You can query the historical database by passing GET parameters (Date format: MMDDYYYY). The system responds with a JSON array of records.
Request example:
https://data.dbmeteo.it/database.php?stat=demo&table=record&date=01012025
Parameters:
stat=: Station identifier.&table=:
- record: 5-min data of the selected date
- hour: hourly data of the last 28 days from the selected date
- day: daily data of the last 365 days from the selected date
- month: monthly data of the selected date&date=: Date in MMDDYYYY format.
📄 Source de Données (API & JSON)
Les données de dbMeteo sont exposées via des API RESTful au format JSON, prêtes à être intégrées dans des sites web, de la domotique ou des applications externes.
1. Données en Direct (alldata)
Le fichier alldata fournit l'état actuel de la station : température, humidité, pression, vent, rayonnement, données astronomiques et statistiques actuelles.
Exemple de requête :
https://data.dbmeteo.it/account/alldata
Paramètres :
account: Identifiant de la station
2. Données Graphiques (graphdata)
Le fichier graphdata contient les séries historiques compressées pour les intervalles de temps : 24h (one), 48h (two), 7j (three), 28j (four), 365j (five).
Exemple de requête :
https://data.dbmeteo.it/account/graphdata
Paramètres :
account: Identifiant de la station
3. API Base de Données Historique
Il est possible d'interroger la base de données historique en passant des paramètres GET (Format de date : MMDDYYYY). Le système répond avec un tableau JSON d'enregistrements.
Exemple de requête :
https://data.dbmeteo.it/database.php?stat=demo&table=record&date=01012025
Paramètres :
stat=: Identifiant de la station.&table=:
- record : données à 5 min de la date sélectionnée
- hour : données horaires des 28 derniers jours à partir de la date sélectionnée
- day : données journalières des 365 derniers jours à partir de la date sélectionnée
- month : données mensuelles de la date sélectionnée&date=: Date au format MMDDYYYY.
📄 Fuente de Datos (API y JSON)
Los datos de dbMeteo se exponen a través de API RESTful en formato JSON, listos para integrarse en sitios web, domótica o aplicaciones externas.
1. Datos en Vivo (alldata)
El archivo alldata proporciona el estado actual de la estación: temperatura, humedad, presión, viento, radiación, datos astronómicos y estadísticas actuales.
Ejemplo de solicitud:
https://data.dbmeteo.it/account/alldata
Parámetros:
account: Identificador de la estación
2. Datos Gráficos (graphdata)
El archivo graphdata contiene las series históricas comprimidas por intervalos de tiempo: 24h (one), 48h (two), 7d (three), 28d (four), 365d (five).
Ejemplo de solicitud:
https://data.dbmeteo.it/account/graphdata
Parámetros:
account: Identificador de la estación
3. API Base de Datos Histórica
Es posible consultar la base de datos histórica pasando parámetros GET (Formato de fecha: MMDDYYYY). El sistema responde con un array JSON de registros.
Ejemplo de solicitud:
https://data.dbmeteo.it/database.php?stat=demo&table=record&date=01012025
Parámetros:
stat=: Identificador de la estación.&table=:
- record: datos a 5 min de la fecha seleccionada
- hour: datos horarios de los últimos 28 días desde la fecha seleccionada
- day: datos diarios de los últimos 365 días desde la fecha seleccionada
- month: datos mensuales de la fecha seleccionada&date=: Fecha en formato MMDDYYYY.
📄 Datenquelle (API & JSON)
dbMeteo-Daten werden über RESTful-APIs im JSON-Format bereitgestellt und können sofort in Websites, Smart Home oder externe Anwendungen integriert werden.
1. Live-Daten (alldata)
Die Datei alldata liefert den aktuellen Status der Station: Temperatur, Luftfeuchtigkeit, Luftdruck, Wind, Strahlung, astronomische Daten und aktuelle Statistiken.
Anfragebeispiel:
https://data.dbmeteo.it/account/alldata
Parameter:
account: Stationskennung
2. Diagrammdaten (graphdata)
Die Datei graphdata enthält komprimierte historische Reihen für Zeitintervalle: 24h (one), 48h (two), 7T (three), 28T (four), 365T (five).
Anfragebeispiel:
https://data.dbmeteo.it/account/graphdata
Parameter:
account: Stationskennung
3. API Historische Datenbank
Sie können die historische Datenbank abfragen, indem Sie GET-Parameter übergeben (Datumsformat: MMDDYYYY). Das System antwortet mit einem JSON-Array von Datensätzen.
Anfragebeispiel:
https://data.dbmeteo.it/database.php?stat=demo&table=record&date=01012025
Parameter:
stat=: Stationskennung.&table=:
- record: 5-Minuten-Daten des ausgewählten Datums
- hour: Stündliche Daten der letzten 28 Tage ab dem ausgewählten Datum
- day: Tägliche Daten der letzten 365 Tage ab dem ausgewählten Datum
- month: Monatliche Daten des ausgewählten Datums&date=: Datum im Format MMDDYYYY.
📊 Widget (Grafici e tabelle)
Strumenti pronti all'uso per importare grafici e tabelle sul tuo sito web.
Puoi importare grafici interattivi (suddivisi per intervalli temporali e tipologia di dato) e una tabella mensile dinamica direttamente nel tuo codice HTML.
1. Grafici Interattivi
Usa questo pannello per configurare il grafico e generare il codice da inserire nel punto desiderato della tua pagina. Nota: è possibile inserire più grafici nella stessa pagina
Incolla anche questo blocco di configurazione prima della chiusura del tag </body>:
                        <script src="https://cdn.jsdelivr.net/npm/chart.js"></script>
                        <script type="module">
                            async function initDBMeteo() {
                              try {
                                const res = await fetch('https://data.dbmeteo.it/vCHART.json?t=' + Date.now());
                                const data = await res.json();
                                await import(`https://data.dbmeteo.it/chartJS.js?v=${data.v}`);
                                if (typeof window.initDBWidget === 'function') window.initDBWidget();
                              } catch (e) { console.error("Errore caricamento script DB Meteo:", e); }
                            }
                            initDBMeteo();
                        </script>
2. Tabella Dati Mensili
Usa questo pannello per configurare la tabella mensile e generare il codice da inserire nel punto desiderato della tua pagina. Puoi aggiungere fino a un massimo di 12 colonne. Nota: è possibile inserire più tabelle nella stessa pagina
Incolla anche questo blocco di configurazione prima della chiusura del tag </body>:
                        <script src="https://cdn.jsdelivr.net/npm/jquery/dist/jquery.min.js"></script>
                        <script type="module">
                            async function initTableWidget() {
                              try {
                                const res = await fetch('https://data.dbmeteo.it/vTABLE.json?t=' + Date.now());
                                const data = await res.json();
                                await import(`https://data.dbmeteo.it/tableJS.js?v=${data.v}`);
                              } catch (e) {
                                console.error("Errore caricamento script Table Meteo:", e);
                              }
                            }
                            initTableWidget();
                        </script>
📊 Widget Summary (Dashboard Live)
Una dashboard completa e interattiva che riassume tutti i dati della tua stazione in un unico widget.
Configura l'account e il tema per generare il codice dell'iframe da inserire nel tuo sito.
3. Configurazione Obbligatoria (Setup)
Per garantire che la dashboard si ridimensioni correttamente su smartphone e tablet, incolla questo script **una sola volta** prima della chiusura del tag </body> del tuo sito:
                        <script>
                          window.addEventListener('message', function(e) {
                            if (e.data && e.data.meteoHeight) {
                              const iframe = document.getElementById('meteo-iframe');
                              if(iframe) iframe.style.height = e.data.meteoHeight + 'px';
                            }
                          }, false);
                        </script>
📊 Summary Widget (Live Dashboard)
A complete and interactive dashboard that summarizes all your station data in a single widget.
Configure the account and theme to generate the iframe code to be inserted into your site.
3. Mandatory Configuration (Setup)
To ensure the dashboard resizes correctly on smartphones and tablets, paste this script **once** before the closing </body> tag of your site:
                        <script>
                          window.addEventListener('message', function(e) {
                            if (e.data && e.data.meteoHeight) {
                              const iframe = document.getElementById('meteo-iframe');
                              if(iframe) iframe.style.height = e.data.meteoHeight + 'px';
                            }
                          }, false);
                        </script>
📊 Widget Résumé (Tableau de bord Live)
Un tableau de bord complet et interactif qui résume toutes les données de votre station dans un seul widget.
Configurez le compte et le thème pour générer le code iframe à insérer sur votre site.
3. Configuration Obligatoire (Setup)
Pour garantir que le tableau de bord se redimensionne correctement sur smartphone et tablette, collez ce script **une seule fois** avant la fermeture de la balise </body> de votre site :
                        <script>
                          window.addEventListener('message', function(e) {
                            if (e.data && e.data.meteoHeight) {
                              const iframe = document.getElementById('meteo-iframe');
                              if(iframe) iframe.style.height = e.data.meteoHeight + 'px';
                            }
                          }, false);
                        </script>
📊 Widget de Resumen (Panel en vivo)
Un panel completo e interactivo que resume todos los datos de tu estación en un único widget.
Configura la cuenta y el tema para generar el código iframe para insertar en tu sitio.
3. Configuración Obligatoria (Setup)
Para garantizar que el panel se redimensione correctamente en smartphones y tablets, pega este script **una sola vez** antes del cierre de la etiqueta </body> de tu sitio:
                        <script>
                          window.addEventListener('message', function(e) {
                            if (e.data && e.data.meteoHeight) {
                              const iframe = document.getElementById('meteo-iframe');
                              if(iframe) iframe.style.height = e.data.meteoHeight + 'px';
                            }
                          }, false);
                        </script>
📊 Zusammenfassungs-Widget (Live-Dashboard)
Ein vollständiges und interaktives Dashboard, das alle Daten Ihrer Station in einem einzigen Widget zusammenfasst.
Konfigurieren Sie das Konto und das Thema, um den Iframe-Code für Ihre Website zu generieren.
3. Obligatorische Konfiguration (Setup)
Um sicherzustellen, dass das Dashboard auf Smartphones und Tablets korrekt skaliert wird, fügen Sie dieses Skript **einmalig** vor dem schließenden </body>-Tag Ihrer Website ein:
                        <script>
                          window.addEventListener('message', function(e) {
                            if (e.data && e.data.meteoHeight) {
                              const iframe = document.getElementById('meteo-iframe');
                              if(iframe) iframe.style.height = e.data.meteoHeight + 'px';
                            }
                          }, false);
                        </script>
🎥 Widget Streaming (Webcam Live & Timelapse)
Player video HLS professionale ultra-reattivo con telemetria meteo in tempo reale, orologio e storico fotografico.
Il player è completamente plug-and-play e integra lo spegnimento automatico dopo 60 secondi di inattività per azzerare il consumo di banda.
3. Configurazione Obbligatoria (Setup)
Incolla questo script una sola volta prima della chiusura del tag </body> del tuo sito per garantire il caricamento del player sempre aggiornato e senza problemi di cache:
<script type="module">
  try {
    const res = await fetch('https://data.dbmeteo.it/vPLAYER.json?t=' + Date.now());
    const data = await res.json();
    await import(`https://data.dbmeteo.it/dbmeteo-player.js?v=${data.v}`);
  } catch (err) {
    await import('https://data.dbmeteo.it/dbmeteo-player.js');
  }
</script>
🎥 Streaming Widget (Live Webcam & Timelapse)
Ultra-responsive professional HLS video player with real-time weather telemetry overlay, clock, and historical time machine.
The player is 100% plug-and-play and includes automatic standby after 60 seconds of inactivity to eliminate bandwidth consumption.
3. Mandatory Configuration (Setup)
Paste this script once before the closing </body> tag of your website to ensure the player is always loaded up-to-date without cache issues:
<script type="module">
  try {
    const res = await fetch('https://data.dbmeteo.it/vPLAYER.json?t=' + Date.now());
    const data = await res.json();
    await import(`https://data.dbmeteo.it/dbmeteo-player.js?v=${data.v}`);
  } catch (err) {
    await import('https://data.dbmeteo.it/dbmeteo-player.js');
  }
</script>
🎥 Widget Streaming (Webcam Live & Timelapse)
Lecteur vidéo HLS professionnel avec incrustation des données météo en temps réel, horloge et historique (Time Machine).
Le widget est entièrement plug-and-play et se met en veille après 60 secondes d'inactivité pour économiser la bande passante.
3. Configuration Obligatoire (Setup)
Collez ce script une seule fois avant la fermeture de la balise </body> de votre site pour garantir le chargement du lecteur toujours à jour sans problèmes de cache :
<script type="module">
  try {
    const res = await fetch('https://data.dbmeteo.it/vPLAYER.json?t=' + Date.now());
    const data = await res.json();
    await import(`https://data.dbmeteo.it/dbmeteo-player.js?v=${data.v}`);
  } catch (err) {
    await import('https://data.dbmeteo.it/dbmeteo-player.js');
  }
</script>
🎥 Widget Streaming (Webcam en Vivo y Timelapse)
Reproductor de video HLS profesional con telemetría meteorológica en tiempo real, reloj e historial fotográfico.
El reproductor es plug-and-play y entra en modo de espera tras 60 segundos de inactividad para optimizar el consumo de datos.
3. Configuración Obligatoria (Setup)
Pega este script una sola vez antes del cierre de la etiqueta </body> de tu sitio para garantizar la carga del reproductor siempre actualizado y sin problemas de caché:
<script type="module">
  try {
    const res = await fetch('https://data.dbmeteo.it/vPLAYER.json?t=' + Date.now());
    const data = await res.json();
    await import(`https://data.dbmeteo.it/dbmeteo-player.js?v=${data.v}`);
  } catch (err) {
    await import('https://data.dbmeteo.it/dbmeteo-player.js');
  }
</script>
🎥 Streaming-Widget (Live-Webcam & Zeitraffer)
Professioneller HLS-Videoplayer mit Echtzeit-Wetterdatenüberlagerung, Uhr und Zeitraffer-Archiv.
Das Widget ist vollständig Plug-and-Play und schaltet nach 60 Sekunden Inaktivität automatisch ab, um Bandbreite zu sparen.
3. Obligatorische Konfiguration (Setup)
Fügen Sie dieses Skript einmalig vor dem schließenden </body>-Tag Ihrer Website ein, um sicherzustellen, dass der Player immer aktuell und ohne Cache-Probleme geladen wird:
<script type="module">
  try {
    const res = await fetch('https://data.dbmeteo.it/vPLAYER.json?t=' + Date.now());
    const data = await res.json();
    await import(`https://data.dbmeteo.it/dbmeteo-player.js?v=${data.v}`);
  } catch (err) {
    await import('https://data.dbmeteo.it/dbmeteo-player.js');
  }
</script>